Fig. 3
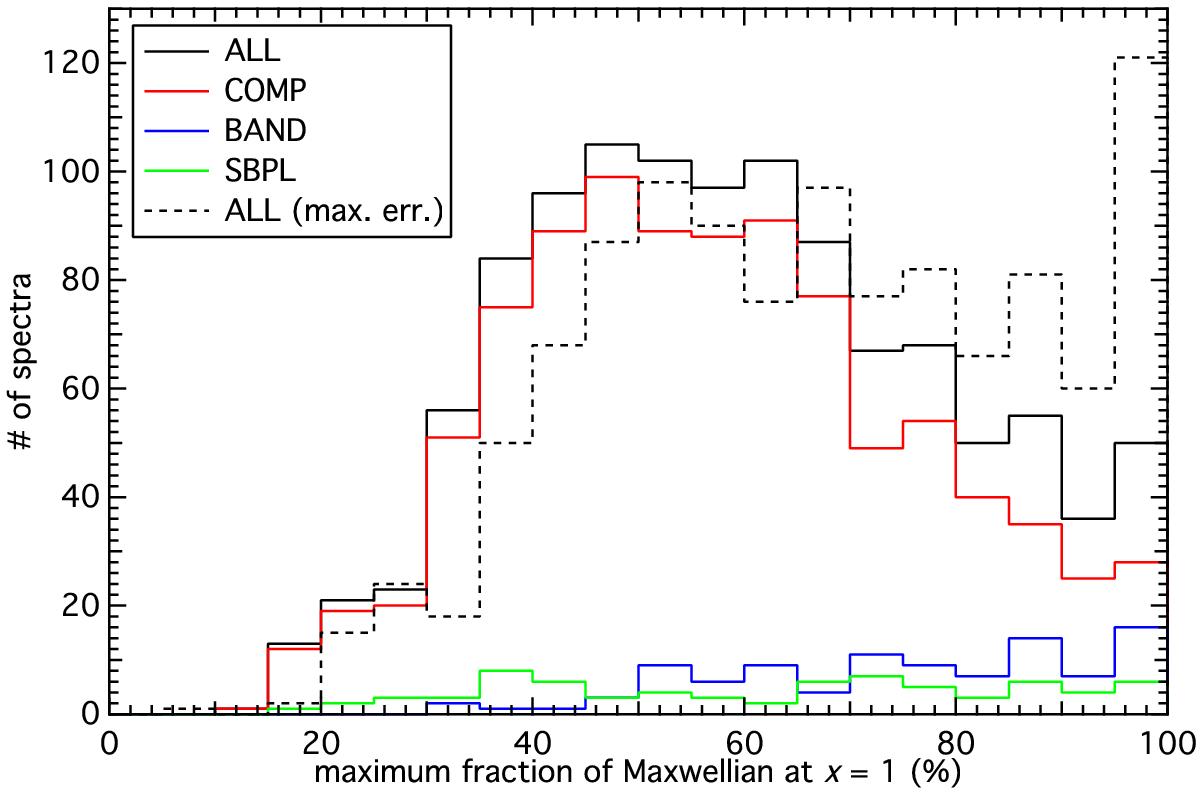
Distribution of the maximum fraction contributed from the Maxwellian synchrotron function at x = 1. The solid histograms represent the distributions using the best-fit model parameters, while the dashed histogram shows the minimum allowed sharpness by the uncertainties from the best-fit parameters. Spectra with 100% at x = 1 are accumulated in the last bin.
Current usage metrics show cumulative count of Article Views (full-text article views including HTML views, PDF and ePub downloads, according to the available data) and Abstracts Views on Vision4Press platform.
Data correspond to usage on the plateform after 2015. The current usage metrics is available 48-96 hours after online publication and is updated daily on week days.
Initial download of the metrics may take a while.