Fig. 2
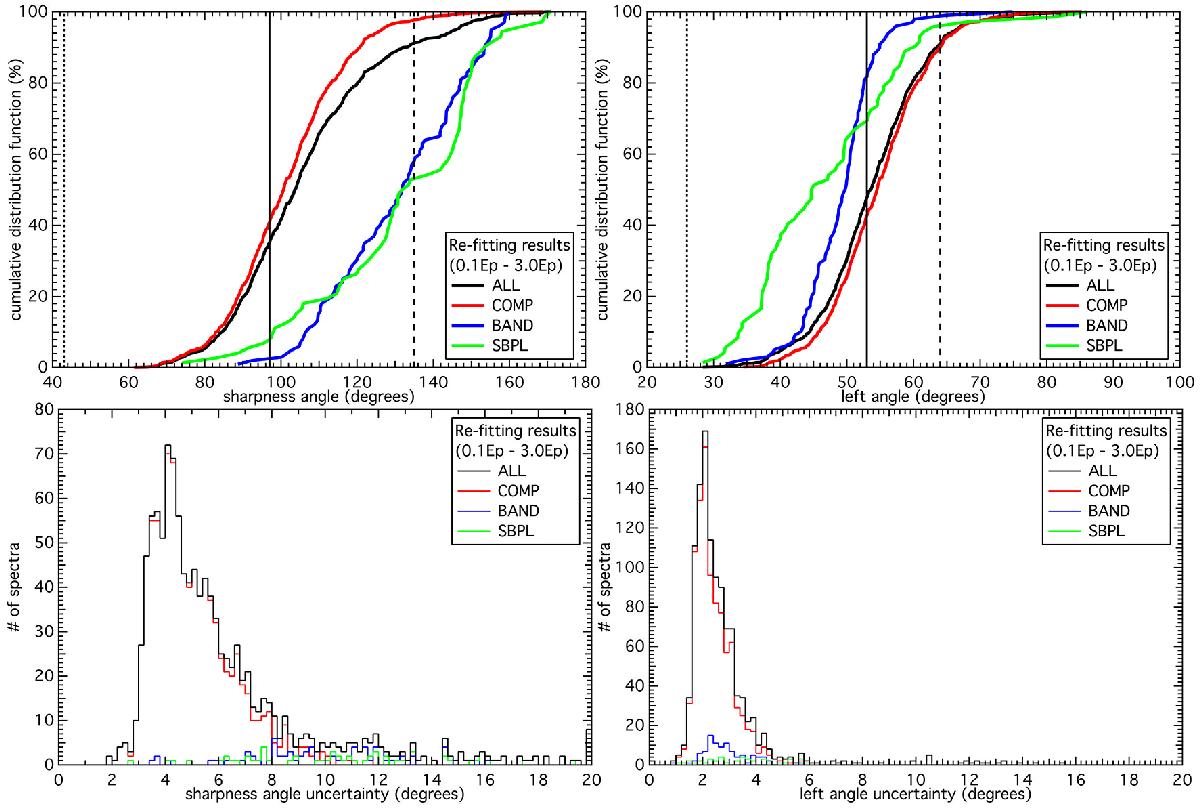
Left panels: cumulative distribution functions of θ and distributions of σθ. Right panels: cumulative distribution functions of θleft and distributions of σleft. The limits of the normalized blackbody (dotted line), single-electron synchrotron (solid line), and synchrotron with a Maxwellian distribution function (dashed line) are overlaid. In the above legends, COMP represents the Comptonized model, BAND represents the Band function, SBPL represents the smoothly broken power law, and ALL represents the overall population (COMP + BAND + SBPL).
Current usage metrics show cumulative count of Article Views (full-text article views including HTML views, PDF and ePub downloads, according to the available data) and Abstracts Views on Vision4Press platform.
Data correspond to usage on the plateform after 2015. The current usage metrics is available 48-96 hours after online publication and is updated daily on week days.
Initial download of the metrics may take a while.