Fig. 13
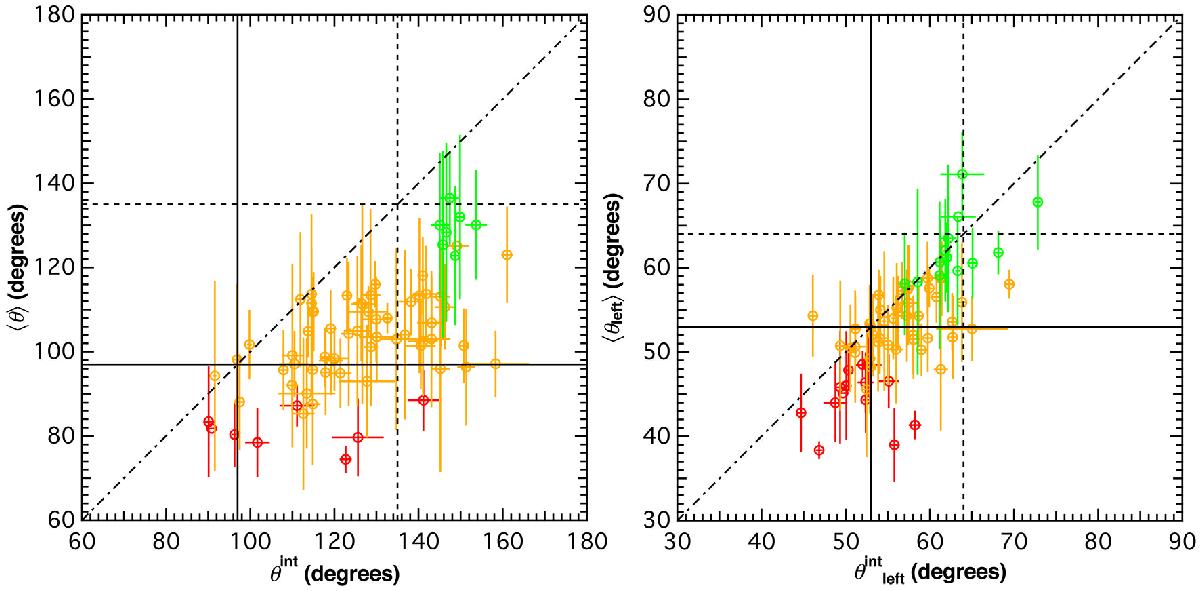
Left panel: comparison between the average sharpness angles, ⟨ θ ⟩, to the sharpness angles computed using the time-integrated catalog, θint. Right panel: comparison between the average left angles, ⟨ θleft ⟩, to the left angles computed using the time-integrated catalog, ![]() . The dash-dotted line shows x = y. The solid and dashed lines show the single-electron synchrotron and Maxwellian synchrotron limit, respectively. We note that the error bars of ⟨ θ ⟩ and ⟨ θleft ⟩ represent the spread in θ and θleft. See main text for the color-coding and details about the plots.
. The dash-dotted line shows x = y. The solid and dashed lines show the single-electron synchrotron and Maxwellian synchrotron limit, respectively. We note that the error bars of ⟨ θ ⟩ and ⟨ θleft ⟩ represent the spread in θ and θleft. See main text for the color-coding and details about the plots.
Current usage metrics show cumulative count of Article Views (full-text article views including HTML views, PDF and ePub downloads, according to the available data) and Abstracts Views on Vision4Press platform.
Data correspond to usage on the plateform after 2015. The current usage metrics is available 48-96 hours after online publication and is updated daily on week days.
Initial download of the metrics may take a while.