Fig. 12
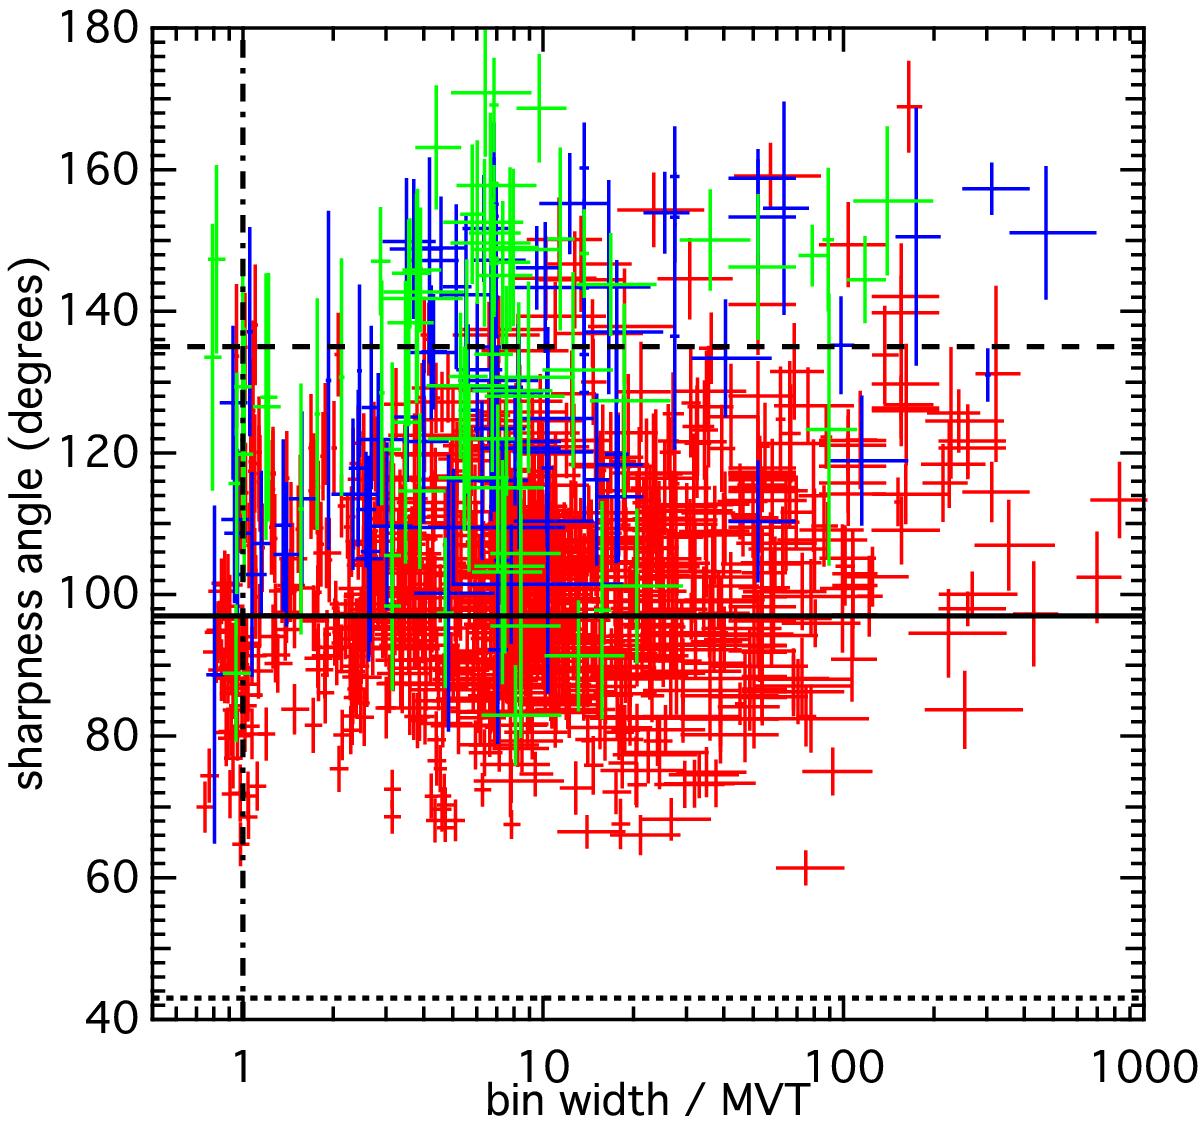
Sharpness angles plotted against the temporal bin widths per MVT. Red dat points show spectra best fit by COMP, blue by BAND, and green by SBPL. The vertical dash-dotted line shows where the bin width equals the MVT, only 4.4% of data points are located to the left of the line. The horizontal lines show the limits of the normalized blackbody (dotted), single-electron synchrotron (solid), and synchrotron emission from a Maxwellian electron distribution (dashed).
Current usage metrics show cumulative count of Article Views (full-text article views including HTML views, PDF and ePub downloads, according to the available data) and Abstracts Views on Vision4Press platform.
Data correspond to usage on the plateform after 2015. The current usage metrics is available 48-96 hours after online publication and is updated daily on week days.
Initial download of the metrics may take a while.