Fig. 11
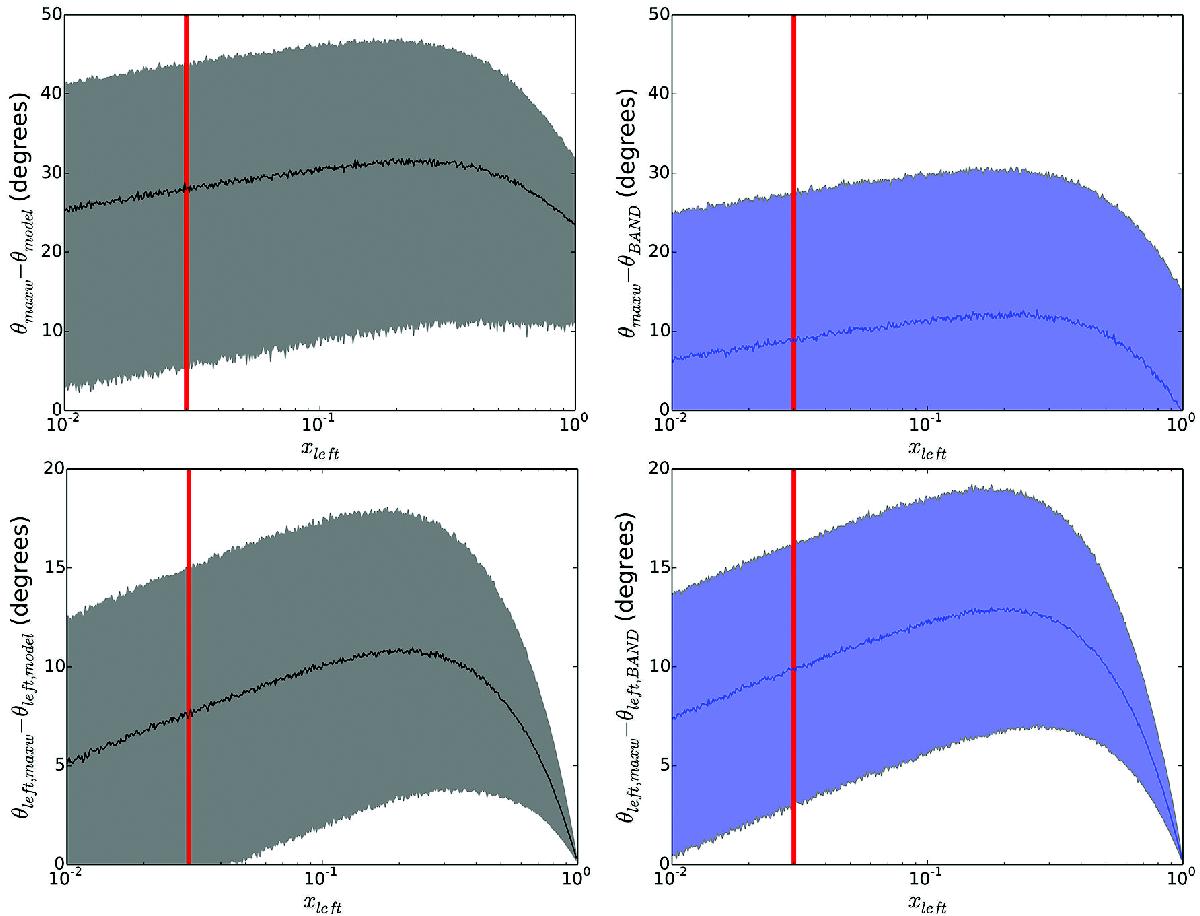
Top left panel: difference between the sharpness angles of the Maxwellian synchrotron function and the re-fitting models, θmaxw−θmodel, as a function of xleft. Top right panel: same for θmaxw−θBAND. Bottom left panel: same for θleft,maxw−θleft,model. Bottom right panel: same for θleft,maxw−θleft,BAND. The red vertical lines show the NaI detector limit of 8 keV ~ 0.03Ep for Ep ~ 250 keV. The shaded regions show the 1σ regions. See main text for details about the plots.
Current usage metrics show cumulative count of Article Views (full-text article views including HTML views, PDF and ePub downloads, according to the available data) and Abstracts Views on Vision4Press platform.
Data correspond to usage on the plateform after 2015. The current usage metrics is available 48-96 hours after online publication and is updated daily on week days.
Initial download of the metrics may take a while.