Fig. 1
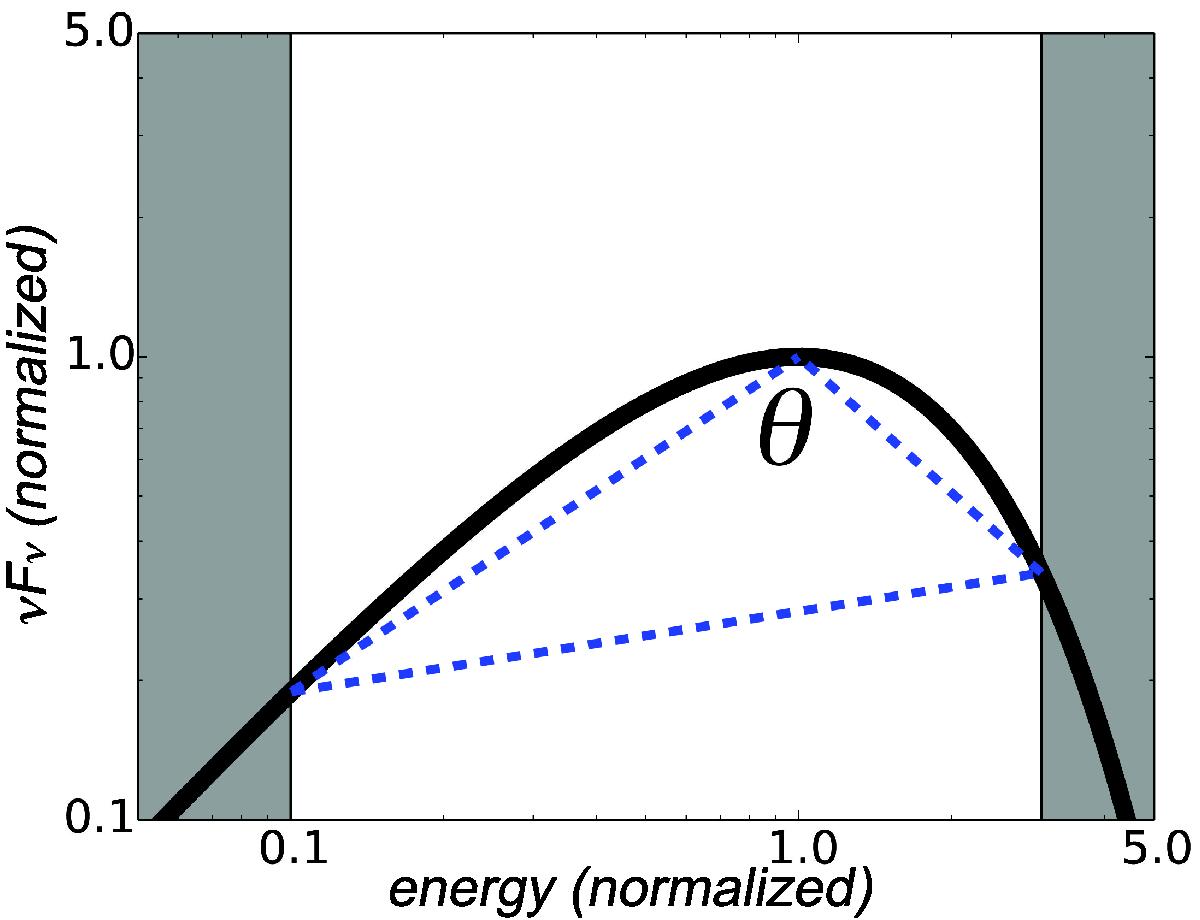
Illustration of how the triangle is constructed and the sharpness angle θ is defined. The shaded regions indicate the data domain (see Sect. 4.2). The triangle is constructed within the triangle domain (see Sect. 4.3), under the best-fit model curve (black). The vertical and horizontal axis are plotted in logarithmic scale in units of normalized νFν flux and photon energy, respectively.
Current usage metrics show cumulative count of Article Views (full-text article views including HTML views, PDF and ePub downloads, according to the available data) and Abstracts Views on Vision4Press platform.
Data correspond to usage on the plateform after 2015. The current usage metrics is available 48-96 hours after online publication and is updated daily on week days.
Initial download of the metrics may take a while.