Fig. 2
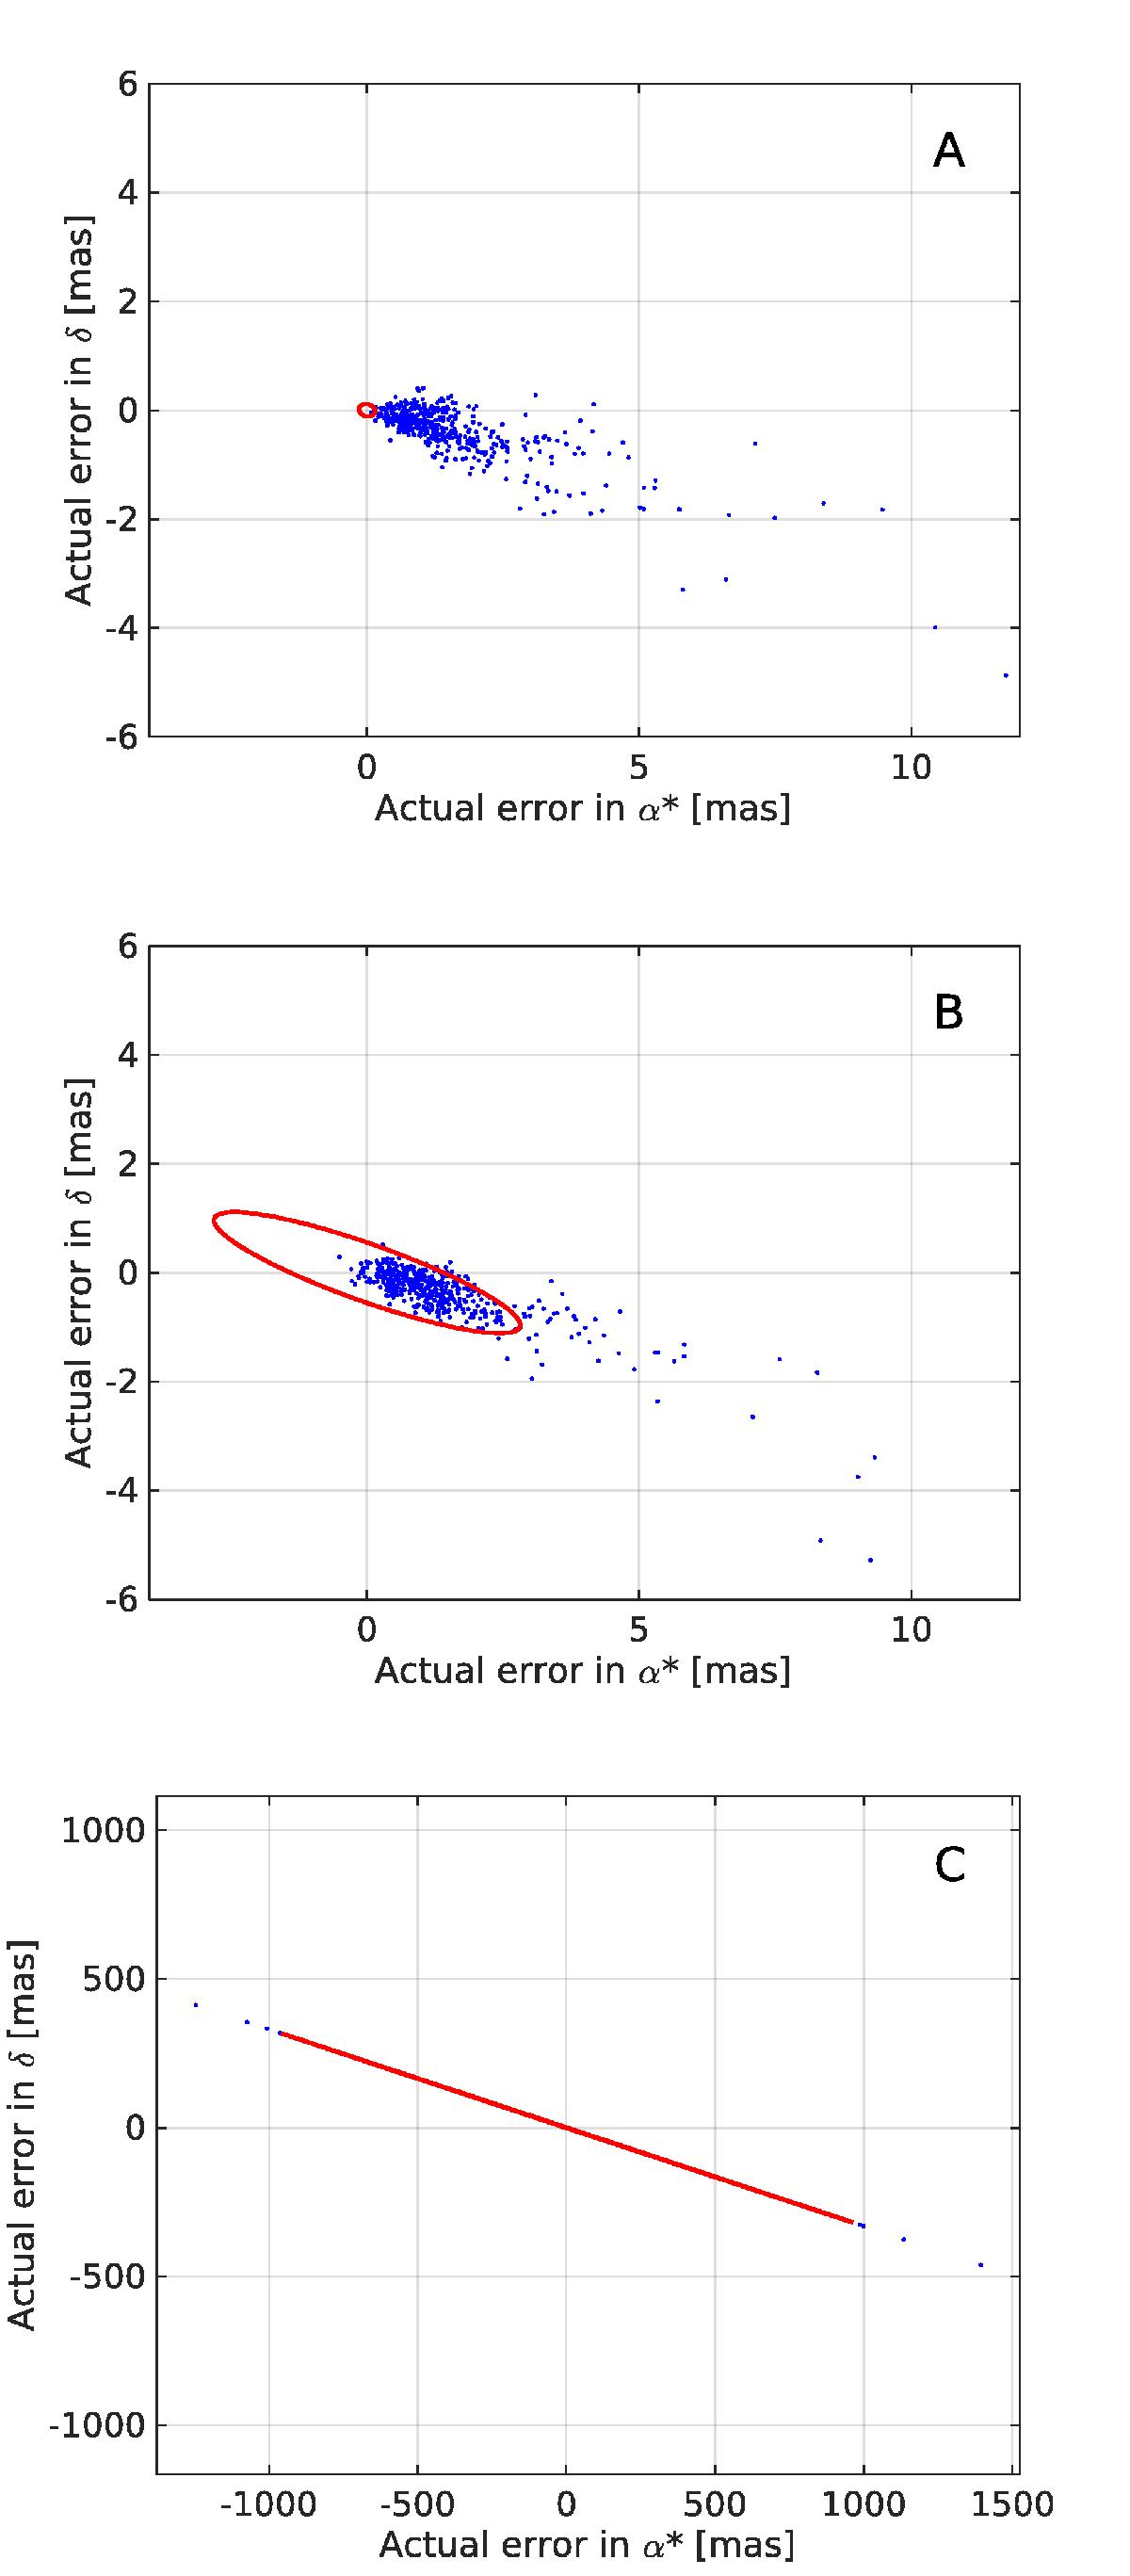
Distribution of position errors for the three cases A, B, and C in Fig. 1. Blue dots: individual astrometric errors. Red curve: 90% confidence ellipse. Prior A is too tight and essentially gives a two-parameter solution. Prior B at the intersection of the curves in Fig. 1 (semi-major axis of the 90% confidence ellipse equals the 90th percentile of the actual errors) produces sensible error estimates. Prior C is too loose and yields a degenerate solution – although not visible in the diagram, 90% of the points are contained in the extremely elongated ellipse.
Current usage metrics show cumulative count of Article Views (full-text article views including HTML views, PDF and ePub downloads, according to the available data) and Abstracts Views on Vision4Press platform.
Data correspond to usage on the plateform after 2015. The current usage metrics is available 48-96 hours after online publication and is updated daily on week days.
Initial download of the metrics may take a while.