Fig. 4
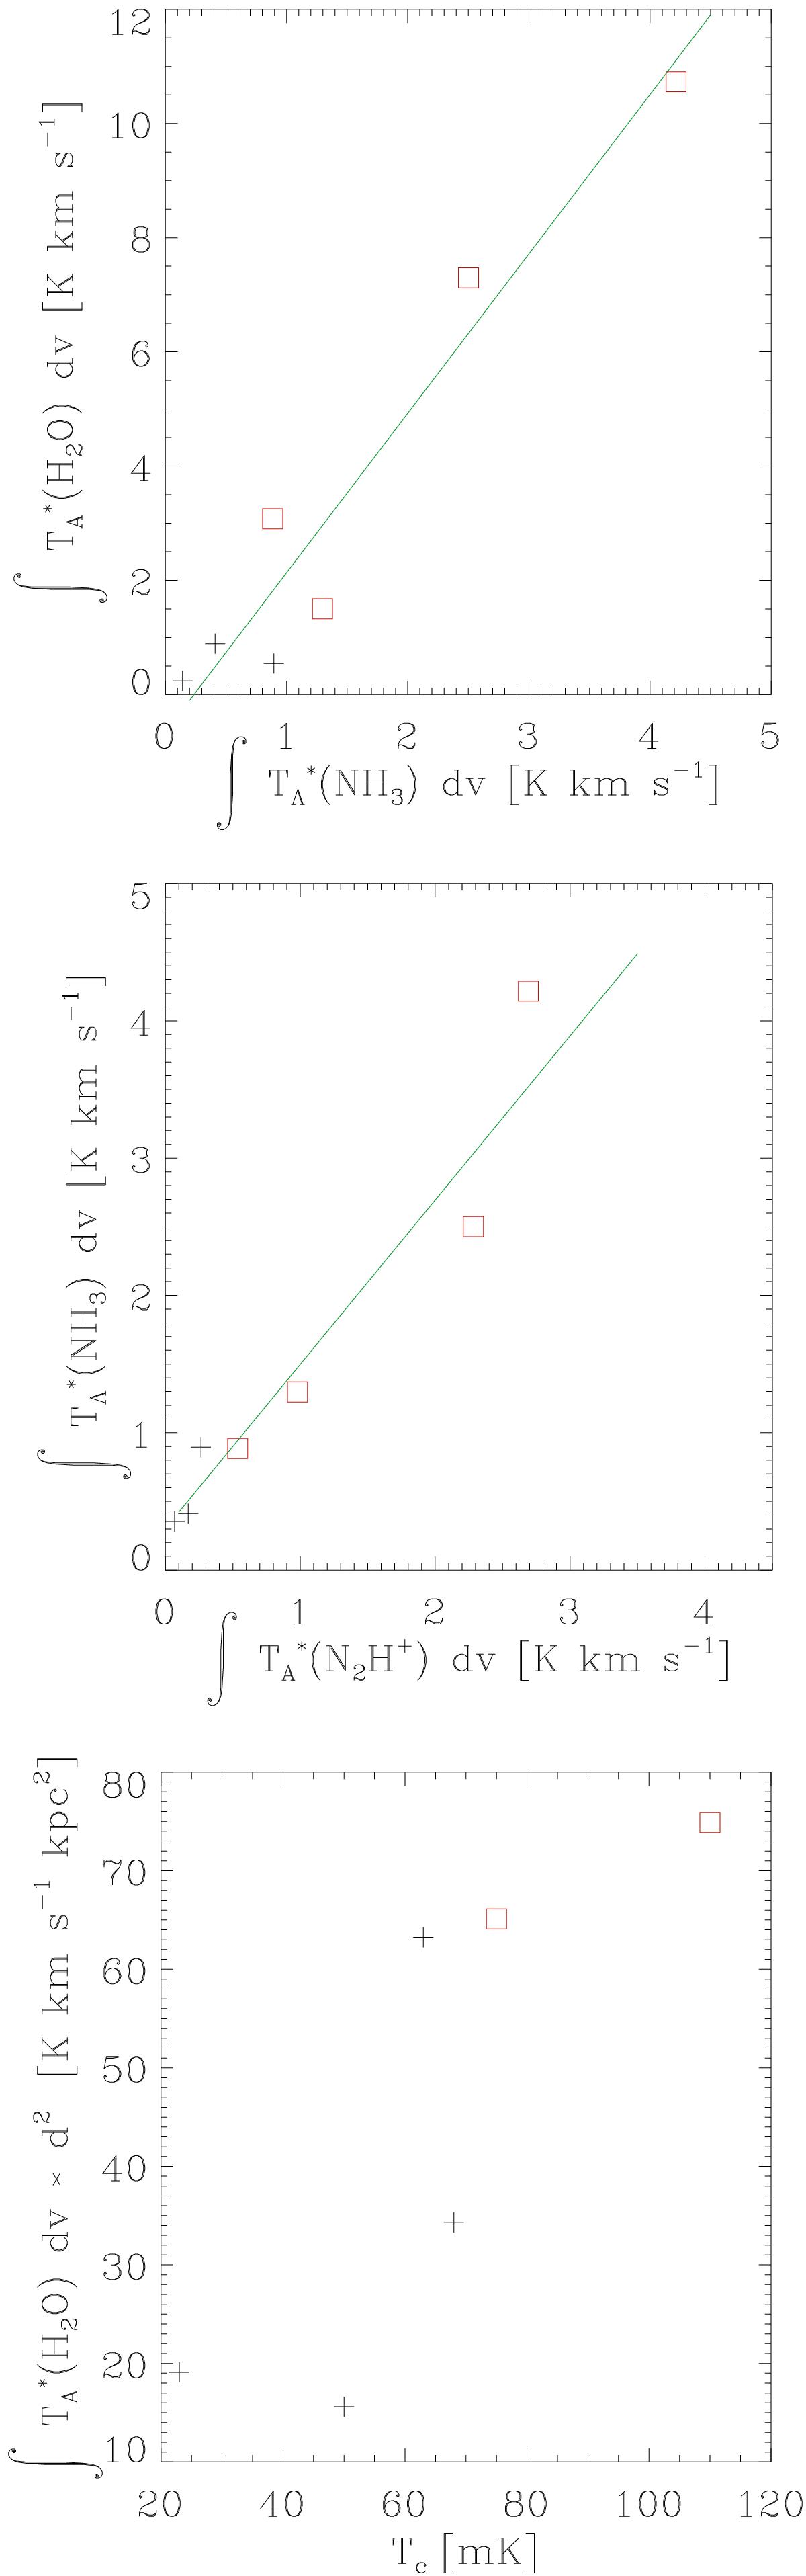
Top panel: integrated H2O (110−101) line intensity plotted vs. the integrated NH3 (10−00) line intensity. Symbols are as in Fig. 2. The solid line represents the linear fit to all points. The Spearman rank coefficient is 0.94. Middle panel: integrated NH3 (10−00) line intensity vs. the integrated N2H+ (6−5) line intensity. Source l30-304 has not been included in the plot (see text). The Spearman rank coefficient is 0.96. Bottom panel: ![]() , proportional to the H2O line luminosity, vs. continuum temperature, Tc. Symbols are as in Fig. 2.
, proportional to the H2O line luminosity, vs. continuum temperature, Tc. Symbols are as in Fig. 2.
Current usage metrics show cumulative count of Article Views (full-text article views including HTML views, PDF and ePub downloads, according to the available data) and Abstracts Views on Vision4Press platform.
Data correspond to usage on the plateform after 2015. The current usage metrics is available 48-96 hours after online publication and is updated daily on week days.
Initial download of the metrics may take a while.