Fig. 2
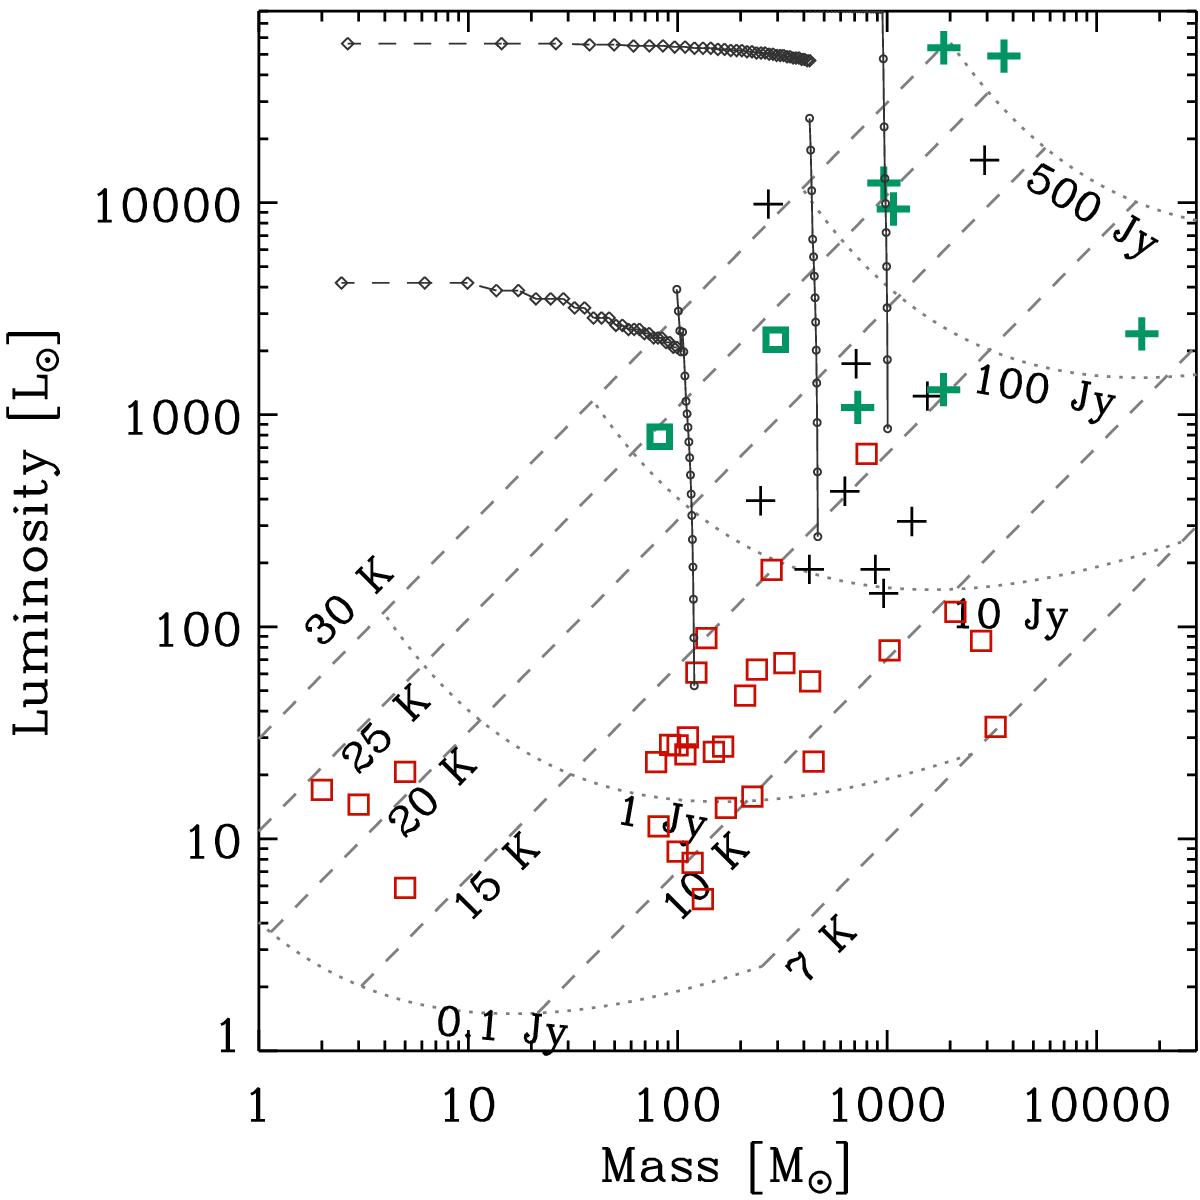
Clump bolometric luminosity vs. mass, as derived from the Hi-GAL observations for all sources where a distance could be determined. Sources in the ℓ = 30° and ℓ = 59° regions are represented by the (black) “+” sign and (red) open squares, respectively. Sources with a detection in at least one of the three observed spectral lines are shown with thicker (green) symbols. The dashed lines are loci at constant temperature. Roughly orthogonal to these are loci (dotted lines) of constant 250μm flux density, ranging from 0.1 to 500 Jy, assuming a modified blackbody spectral energy distribution with β = 1.5 and a fixed distance of ~6 kpc, equal to the median of the distances of the observed sources. The black dots and the lines joining them represent the evolutionary tracks of clumps with starting envelope mass equal to 120, 470 and 103 M⊙ (see Sect. 4.4).
Current usage metrics show cumulative count of Article Views (full-text article views including HTML views, PDF and ePub downloads, according to the available data) and Abstracts Views on Vision4Press platform.
Data correspond to usage on the plateform after 2015. The current usage metrics is available 48-96 hours after online publication and is updated daily on week days.
Initial download of the metrics may take a while.