Fig. 1
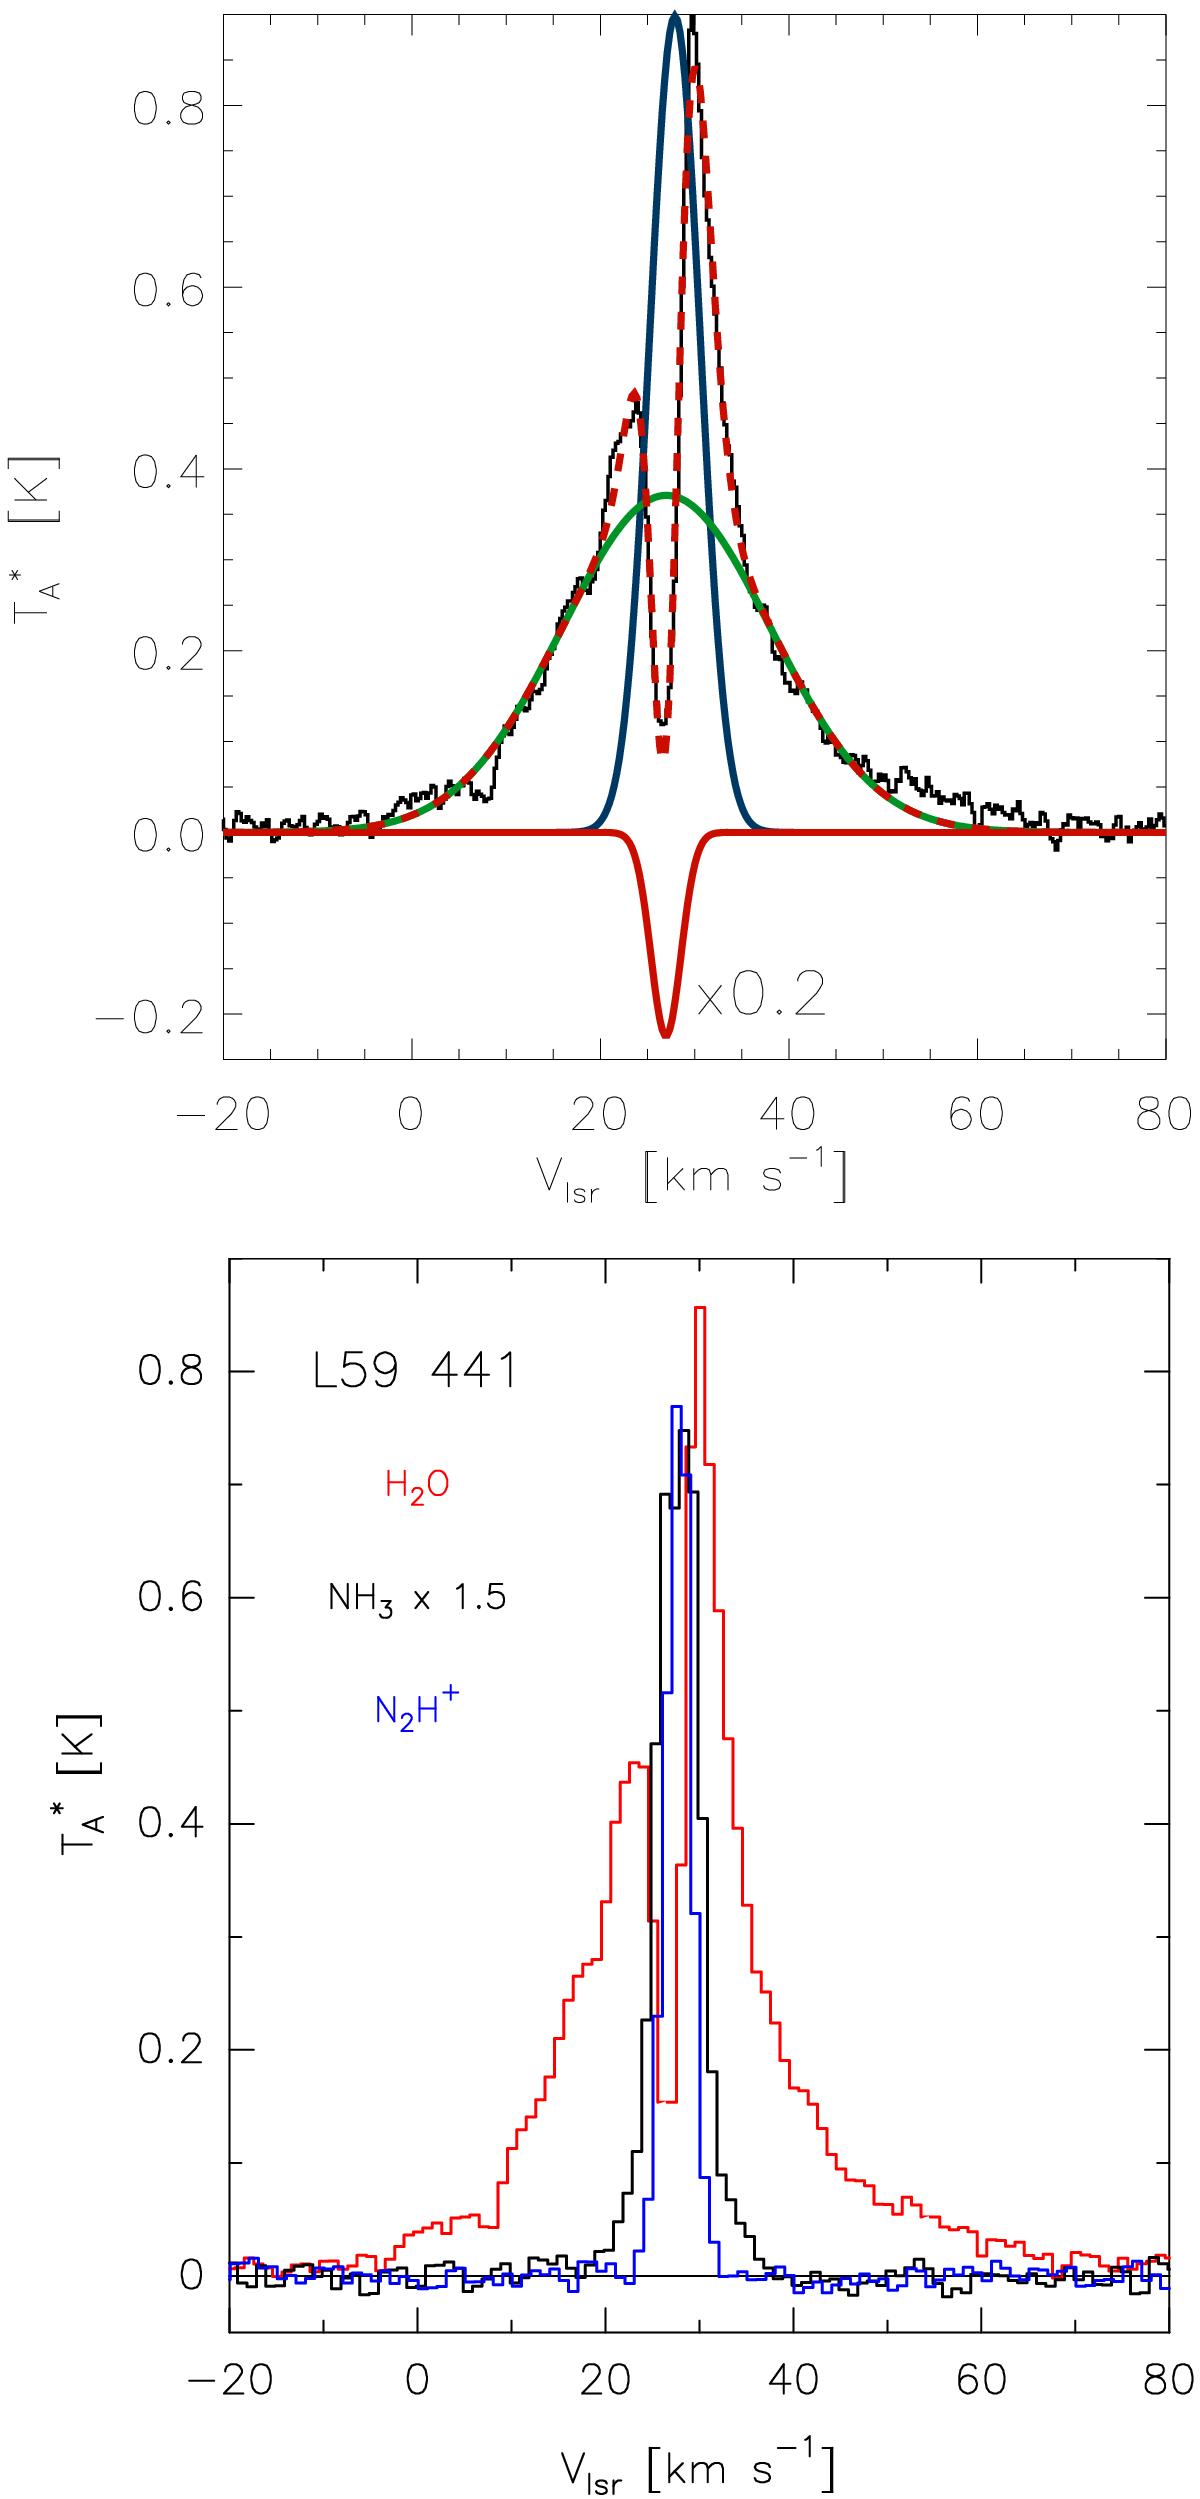
Top panel: Gaussian decomposition of the o-H2O (110−101) spectrum toward the source l59-441. The individual Gaussian components are shown with solid color lines overlaid on the (continuum-subtracted) spectrum. The overall Gaussian fit is shown with a red dashed line, and the residual deviation at a velocity of ≃55 km s-1 is visible. The intensity of the component in absorption has been multiplied by a 0.2 factor. Bottom panel: overlay of the o-H2O (110−101), o-NH3 (10−00) and N2H+ (6−5) lines toward the source l59-441.
Current usage metrics show cumulative count of Article Views (full-text article views including HTML views, PDF and ePub downloads, according to the available data) and Abstracts Views on Vision4Press platform.
Data correspond to usage on the plateform after 2015. The current usage metrics is available 48-96 hours after online publication and is updated daily on week days.
Initial download of the metrics may take a while.