Fig. 9
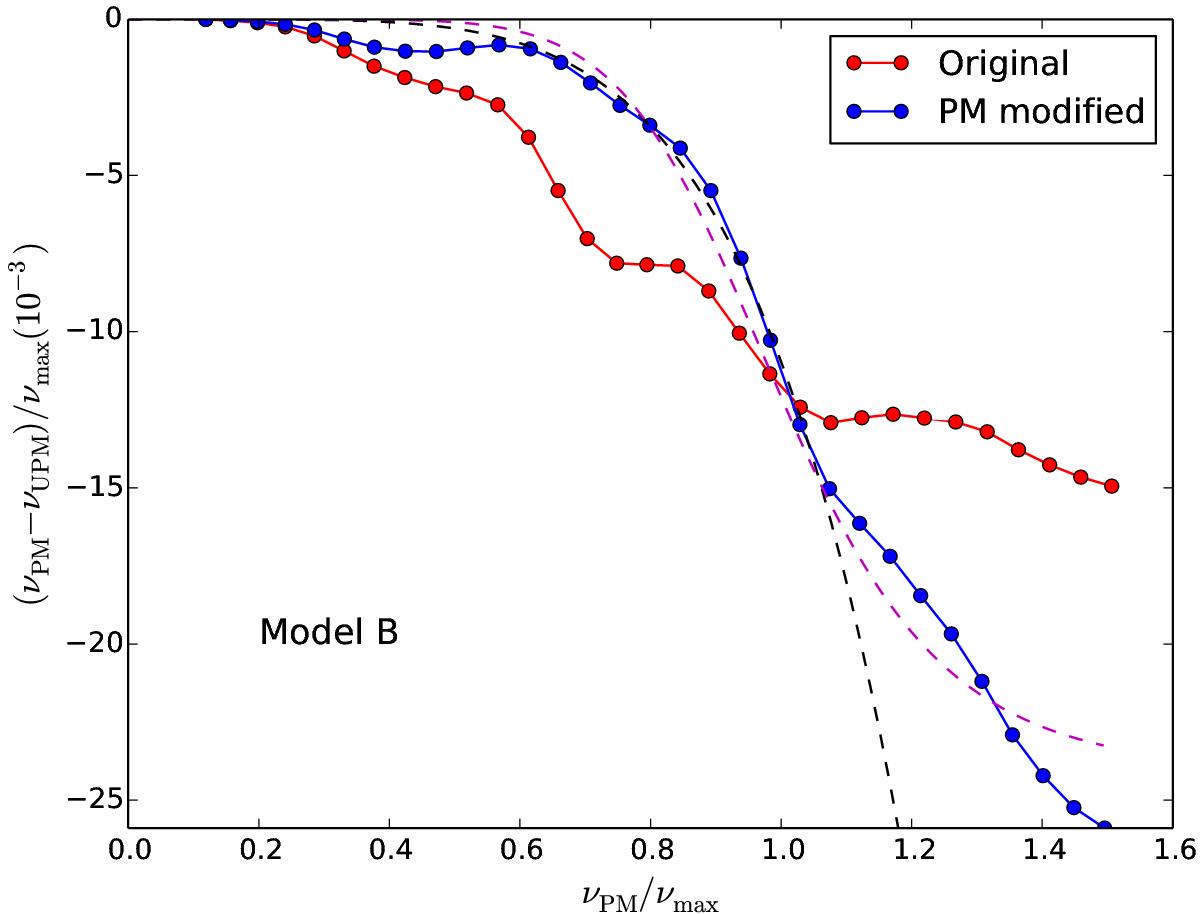
Frequency difference between PM and UPM as a function of the reduced frequency (the red curve with dots, same as the bottom panel of Fig. 3). For the blue one, the value of Vg is modified in PM as shown with the blue curve in the top panel of Fig. 8. The dashed black and magenta lines are fitting curves with Eqs. (4) and (9). The resulting coefficients are (a,b) = (−1.10 × 10-2,5.21) for Eq. (4) and (α/ 2,β) = (−1.21 × 10-2,8.00) for Eq. (9).
Current usage metrics show cumulative count of Article Views (full-text article views including HTML views, PDF and ePub downloads, according to the available data) and Abstracts Views on Vision4Press platform.
Data correspond to usage on the plateform after 2015. The current usage metrics is available 48-96 hours after online publication and is updated daily on week days.
Initial download of the metrics may take a while.