Fig. 10
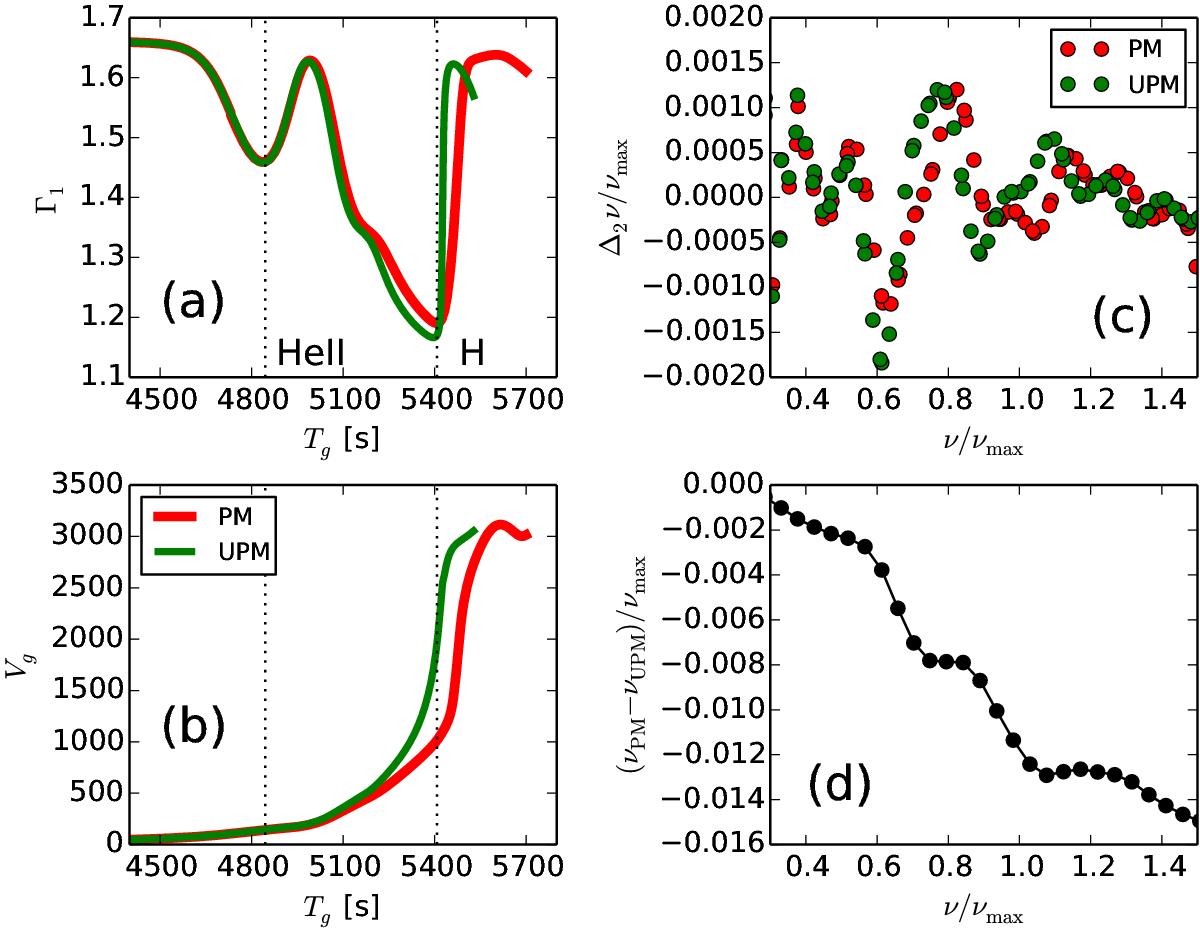
Profiles of the original PM and UPM for Model B. Panels a) and b) show Γ1 and Vg, respectively, as functions of the acoustic radius Tg. The dotted vertical lines indicate the locations of the Γ1 bumps due to the HeII and the H ionizations. Panels c) and d) show the second difference for ℓ = 0–2 and the frequency difference between PM and UPM for the radial modes, respectively, as functions of the frequency.
Current usage metrics show cumulative count of Article Views (full-text article views including HTML views, PDF and ePub downloads, according to the available data) and Abstracts Views on Vision4Press platform.
Data correspond to usage on the plateform after 2015. The current usage metrics is available 48-96 hours after online publication and is updated daily on week days.
Initial download of the metrics may take a while.