Fig. 1
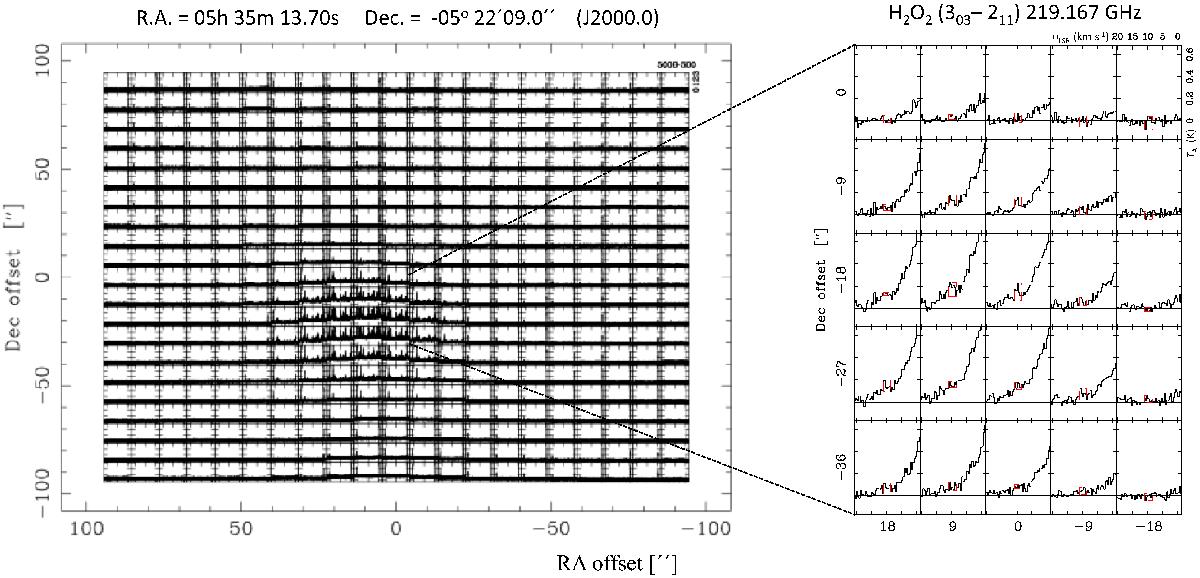
Left: the 3′×3′ mapped area, sampled at 9′′ with the origin at the Orion H2-Peak 1 position, i.e., α2000 = 05h35m13![]() 70, δ2000 = −05° 22′ 09
70, δ2000 = −05° 22′ 09![]() 0. A core of intense emission is clearly seen just below the centre. Right: centred on (0′′, −18′′), this partial map demonstrates that the 219.17 GHz feature is a point source to the 28′′ beam. This weak spectral feature is identified inside the red markers. It is sitting on top of the red wing of a much stronger line (HC3N (ν7 = 3), Sutton et al. 1985).
0. A core of intense emission is clearly seen just below the centre. Right: centred on (0′′, −18′′), this partial map demonstrates that the 219.17 GHz feature is a point source to the 28′′ beam. This weak spectral feature is identified inside the red markers. It is sitting on top of the red wing of a much stronger line (HC3N (ν7 = 3), Sutton et al. 1985).
Current usage metrics show cumulative count of Article Views (full-text article views including HTML views, PDF and ePub downloads, according to the available data) and Abstracts Views on Vision4Press platform.
Data correspond to usage on the plateform after 2015. The current usage metrics is available 48-96 hours after online publication and is updated daily on week days.
Initial download of the metrics may take a while.