Fig. 9
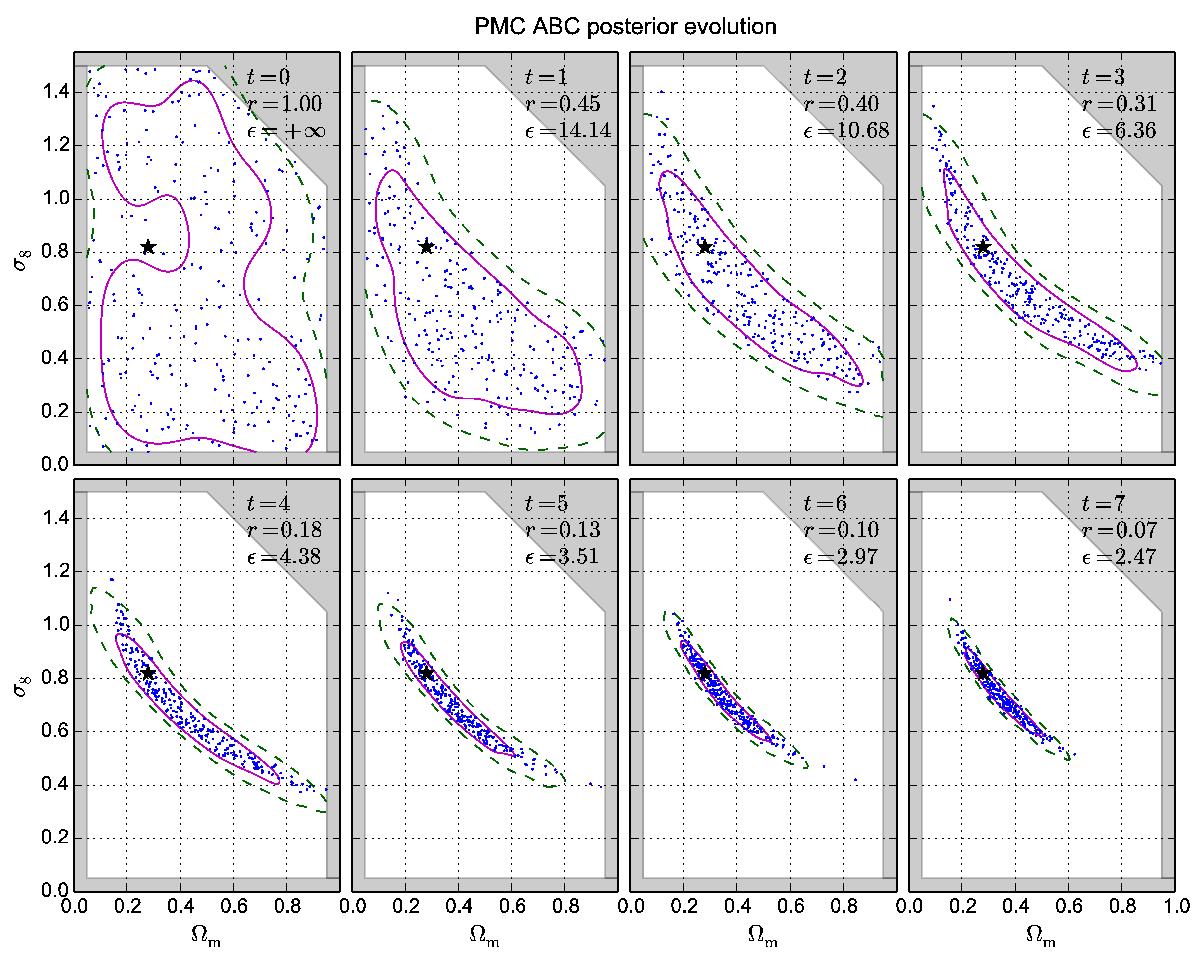
Evolution of particles and the posterior from the PMC ABC algorithm. We show results from the first 8 iterations (0 ≤ t ≤ 7). Particles are given by blue dots. Solid lines are 1σ contours, and dashed lines are 2σ contours. White areas represent the prior. The corresponding accept rate r and tolerance level ϵ are also given. We set ϵ(0) = +∞.
Current usage metrics show cumulative count of Article Views (full-text article views including HTML views, PDF and ePub downloads, according to the available data) and Abstracts Views on Vision4Press platform.
Data correspond to usage on the plateform after 2015. The current usage metrics is available 48-96 hours after online publication and is updated daily on week days.
Initial download of the metrics may take a while.