Fig. 8
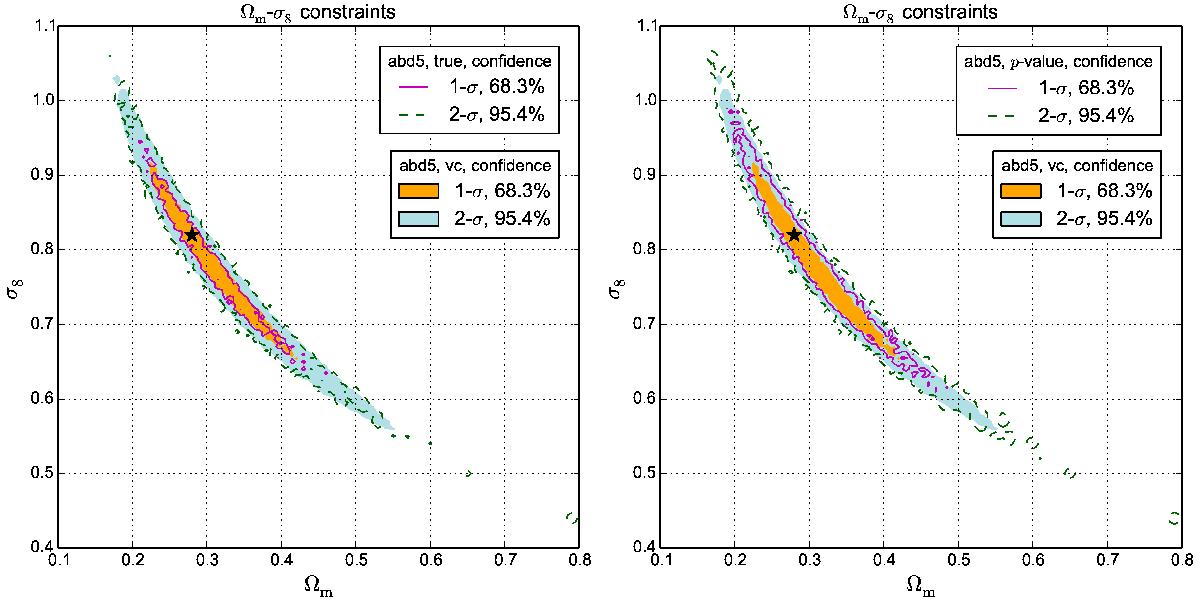
Left panel: confidence regions derived from Lvc (colored areas) and Ltrue (solid and dashed lines) with xabd5. Right panel: confidence regions derived from Lvc (colored areas) and p-value analysis (solid and dashed lines). The contours from Ltrue and p-value analysis are noisy due to a relatively low N for probability estimation. We notice that Lvc and Ltrue yield very similar results.
Current usage metrics show cumulative count of Article Views (full-text article views including HTML views, PDF and ePub downloads, according to the available data) and Abstracts Views on Vision4Press platform.
Data correspond to usage on the plateform after 2015. The current usage metrics is available 48-96 hours after online publication and is updated daily on week days.
Initial download of the metrics may take a while.