Free Access
Fig. 7
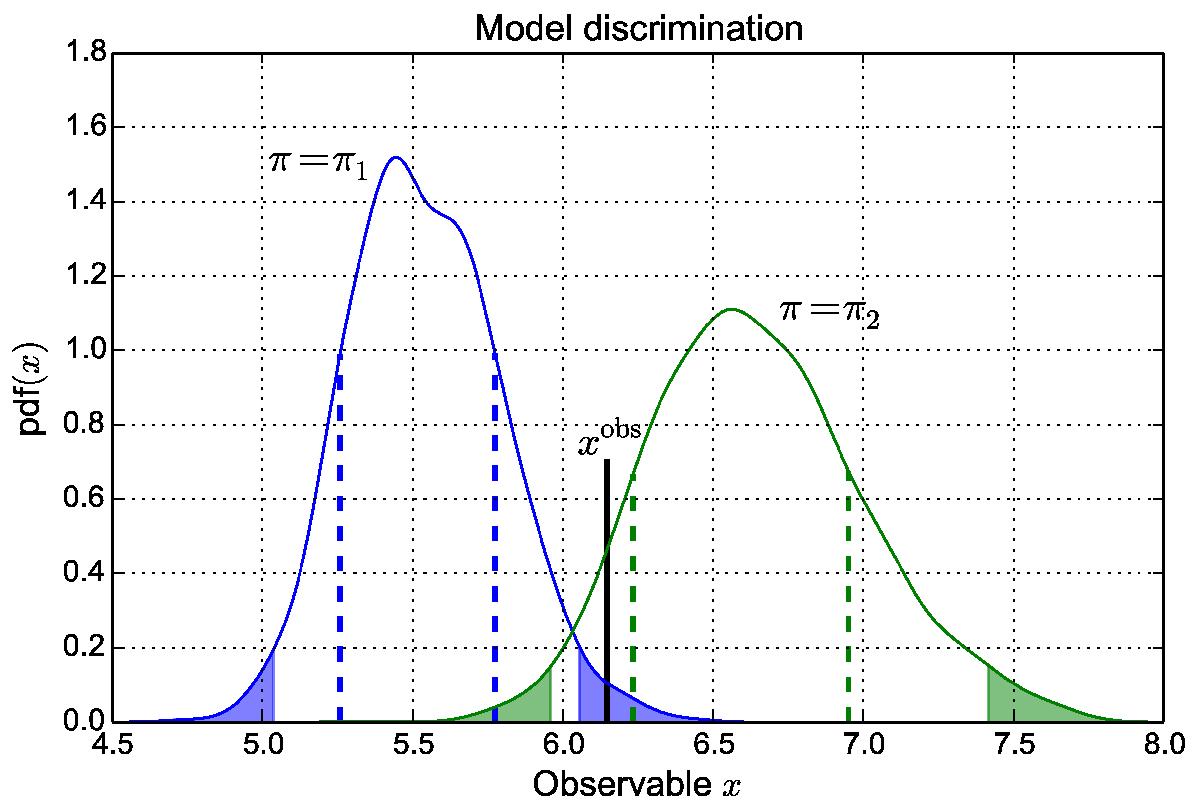
PDF from two different models (denoted by π1 and π2) and the observation xobs. The dashed lines show 1σ intervals for both models, while the shaded areas are intervals beyond the 2σ level. In this figure, model π1 is excluded at more than 2σ, whereas the significance of the model π2 is between 1 and 2σ.
Current usage metrics show cumulative count of Article Views (full-text article views including HTML views, PDF and ePub downloads, according to the available data) and Abstracts Views on Vision4Press platform.
Data correspond to usage on the plateform after 2015. The current usage metrics is available 48-96 hours after online publication and is updated daily on week days.
Initial download of the metrics may take a while.