Fig. 6
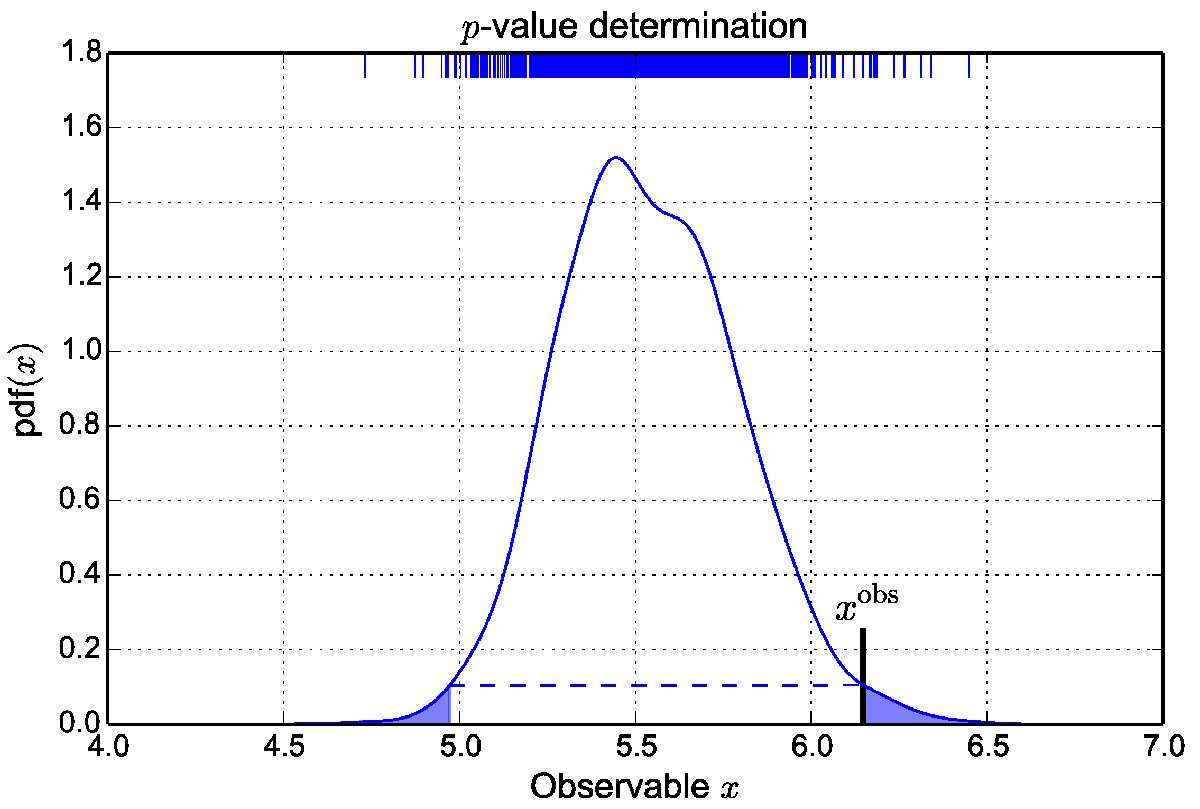
Example for the p-value determination. The x-axis indicates a one-dimensional observable, and the y-axis is the PDF. The PDF is obtained from a kernel density estimation using the N = 1000 realizations. Their values are shown as bars in the rug plot at the top of the panel. The shaded area is the corresponding p-value for given observational data xobs.
Current usage metrics show cumulative count of Article Views (full-text article views including HTML views, PDF and ePub downloads, according to the available data) and Abstracts Views on Vision4Press platform.
Data correspond to usage on the plateform after 2015. The current usage metrics is available 48-96 hours after online publication and is updated daily on week days.
Initial download of the metrics may take a while.