Free Access
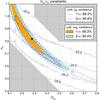
Fig. 4
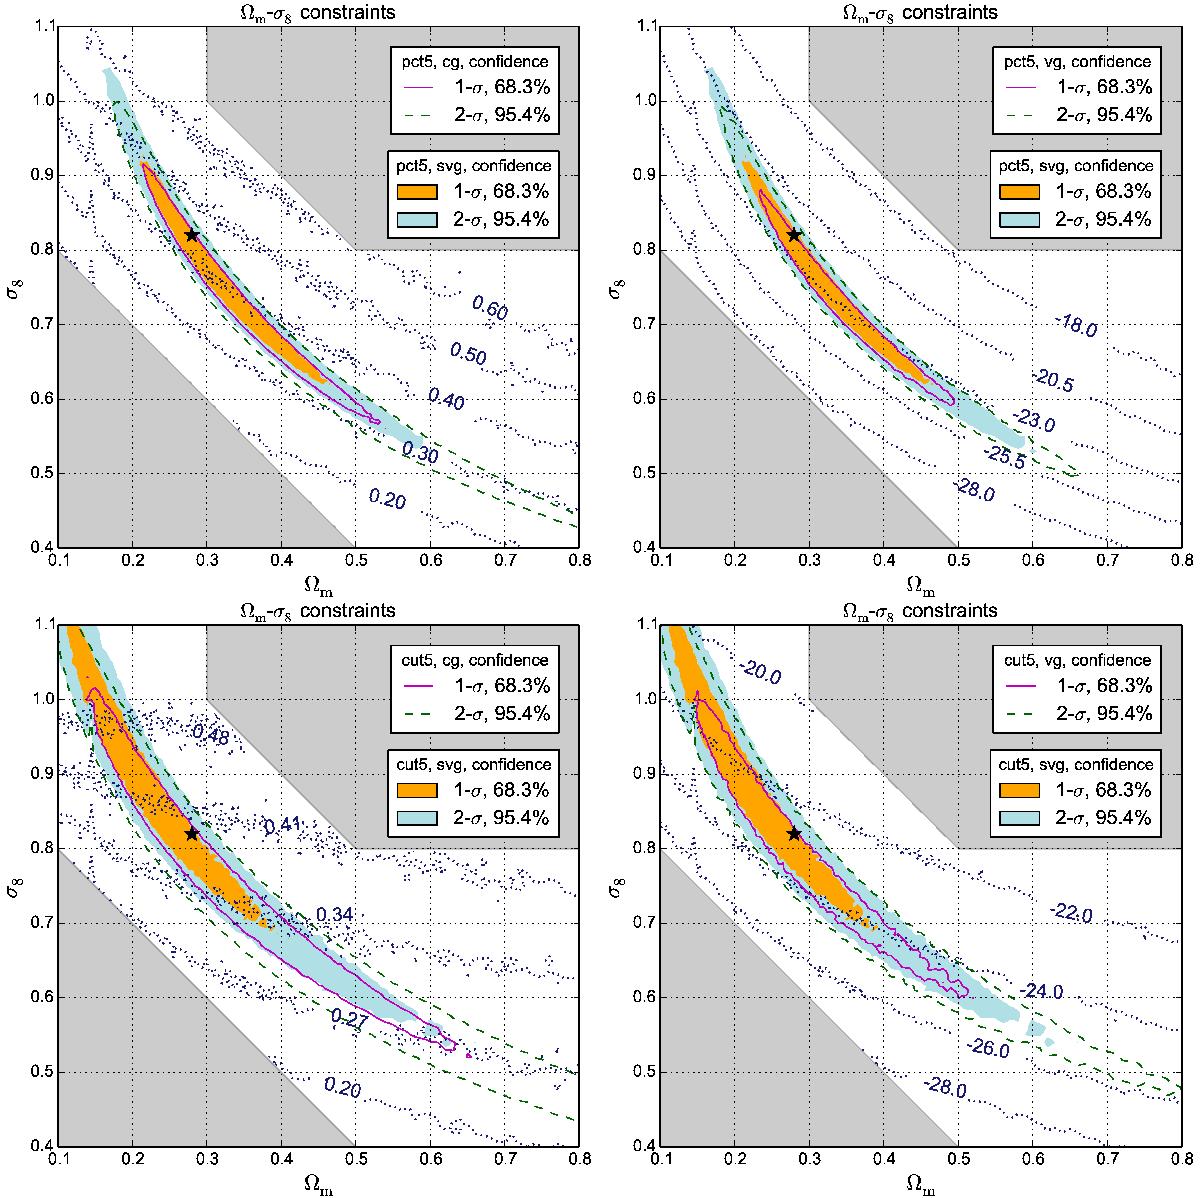
Similar to Fig. 3. Confidence regions with xpct5 and xcut5. Both upper panels are drawn with xpct5 and both lower panels with xcut5. Both left panels are the comparison between Lcg and Lsvg, and both right panels between Lsvg and Lvg.
This figure is made of several images, please see below:
Current usage metrics show cumulative count of Article Views (full-text article views including HTML views, PDF and ePub downloads, according to the available data) and Abstracts Views on Vision4Press platform.
Data correspond to usage on the plateform after 2015. The current usage metrics is available 48-96 hours after online publication and is updated daily on week days.
Initial download of the metrics may take a while.