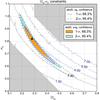
Fig. 3
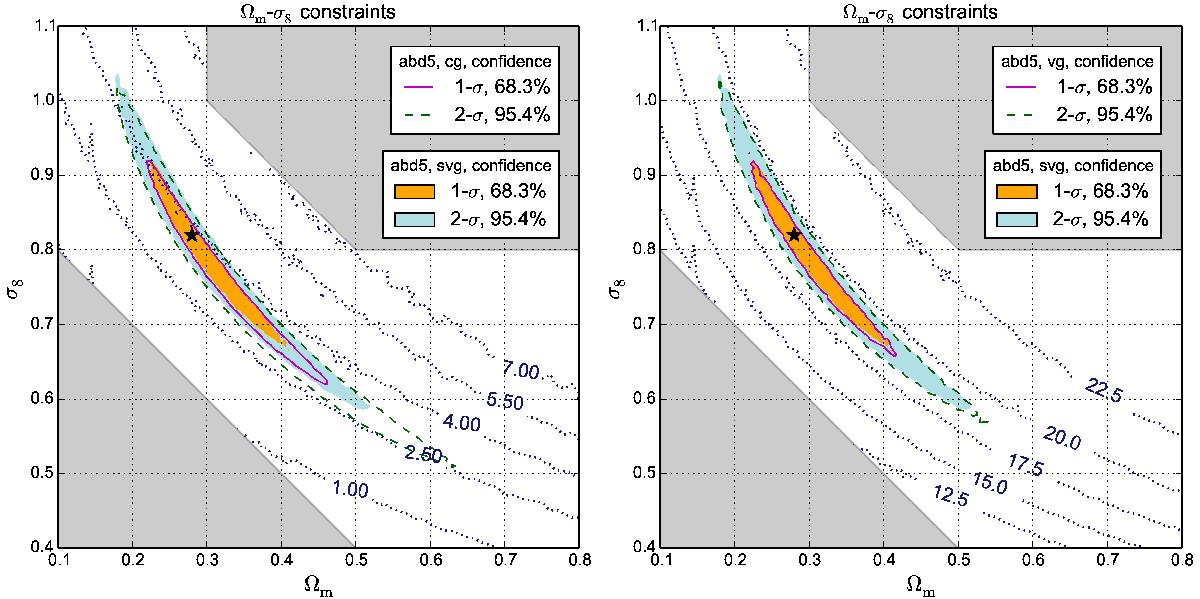
Confidence regions derived from Lcg, Lsvg, and Lvg with xabd5. The solid and dashed lines represent Lcg in the left panel and Lvg in the right panel, while the colored areas are from Lsvg. The black star stands for πin and gray areas represent the non-explored parameter space. The dotted lines are different isolines, the variance Ĉ55 of the bin with highest S/N in the left panel and ln(detĈ) for the right panel. The contour area is reduced by 22% when taking the CDC effect into account. The parameter-dependent determinant term does not contribute significantly.
Current usage metrics show cumulative count of Article Views (full-text article views including HTML views, PDF and ePub downloads, according to the available data) and Abstracts Views on Vision4Press platform.
Data correspond to usage on the plateform after 2015. The current usage metrics is available 48-96 hours after online publication and is updated daily on week days.
Initial download of the metrics may take a while.