Fig. 2

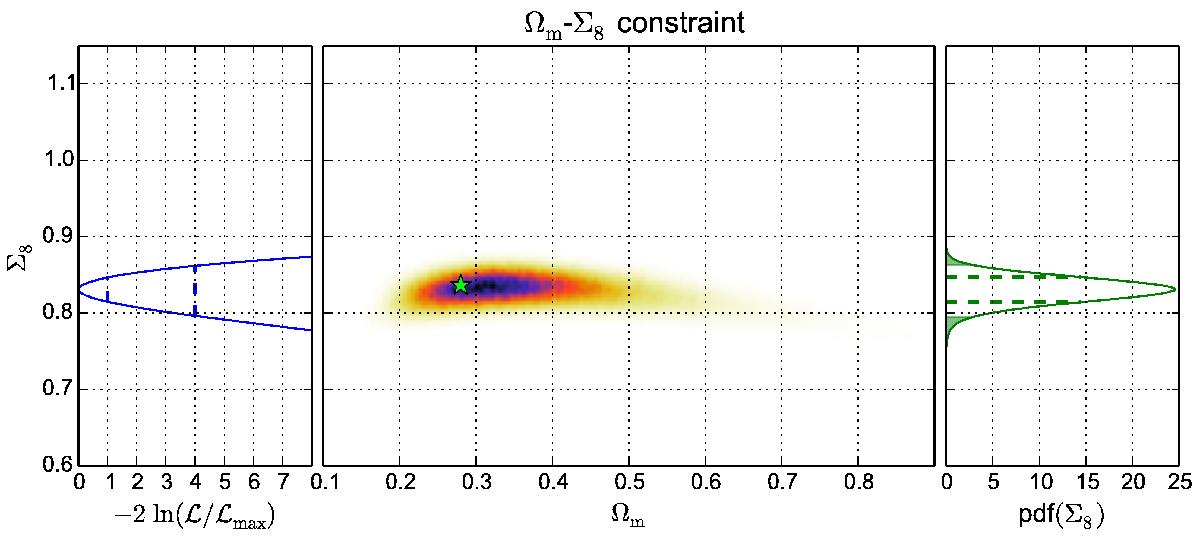
Middle panel: likelihood value using xabd5 on the Ωm-Σ8 plane. The green star represents the input cosmology πin. Since log σ8 and log Ωm form an approximately linear degenerency, the quantity Σ8 ≡ σ8(Ωm/ 0.27)α allows us to characterize the banana-shape contour thickness. Right panel: the marginalized PDF of Σ8. The dashed lines give the 1σ interval (68.3%), while the borders of the shaded areas represent 2σ limits (95.4%). Left panel: log-value of the marginalized likelihood ratio. Dashed lines in the left panel give the corresponding value for 1 and 2σ significance levels, respectively.
Current usage metrics show cumulative count of Article Views (full-text article views including HTML views, PDF and ePub downloads, according to the available data) and Abstracts Views on Vision4Press platform.
Data correspond to usage on the plateform after 2015. The current usage metrics is available 48-96 hours after online publication and is updated daily on week days.
Initial download of the metrics may take a while.


