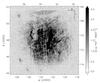
Fig. 6
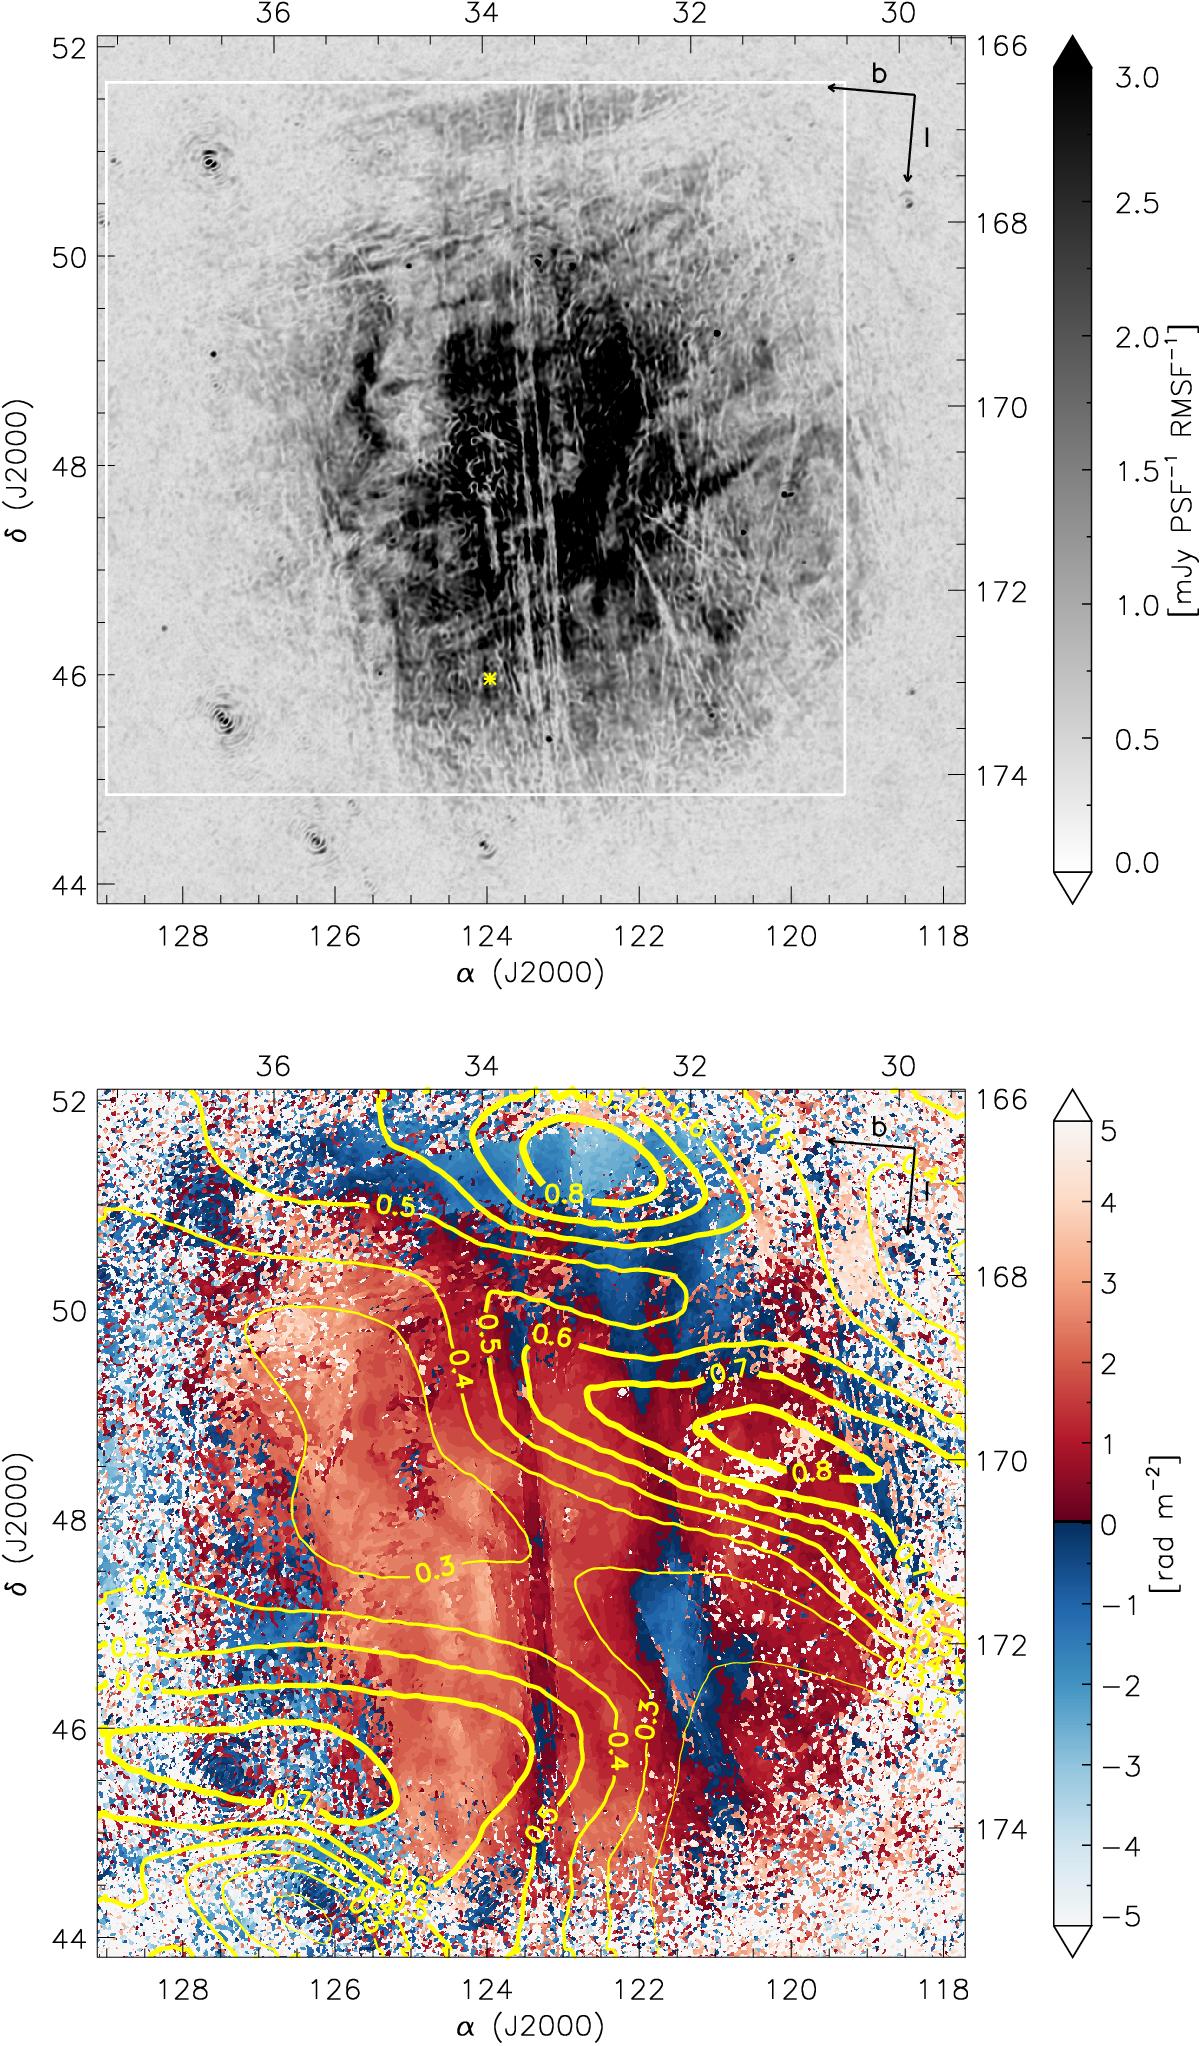
Upper image: highest peak of the Faraday depth spectrum in polarization at each spatial pixel. Bottom image: map of the RM value of each peak, shown in red-blue colour scale. Yellow contours are showing Hα intensity on a one degree scale (Finkbeiner 2003; Haffner et al. 2003), given in units of Rayleighs (see Sect. 5). A white box indicates the boundaries of the WSRT 350 MHz image in Fig. 10. A location of the discovered pulsar J081558+461155 (see Sect. 3.3) is shown with a yellow asterisk.
Current usage metrics show cumulative count of Article Views (full-text article views including HTML views, PDF and ePub downloads, according to the available data) and Abstracts Views on Vision4Press platform.
Data correspond to usage on the plateform after 2015. The current usage metrics is available 48-96 hours after online publication and is updated daily on week days.
Initial download of the metrics may take a while.