Fig. 4
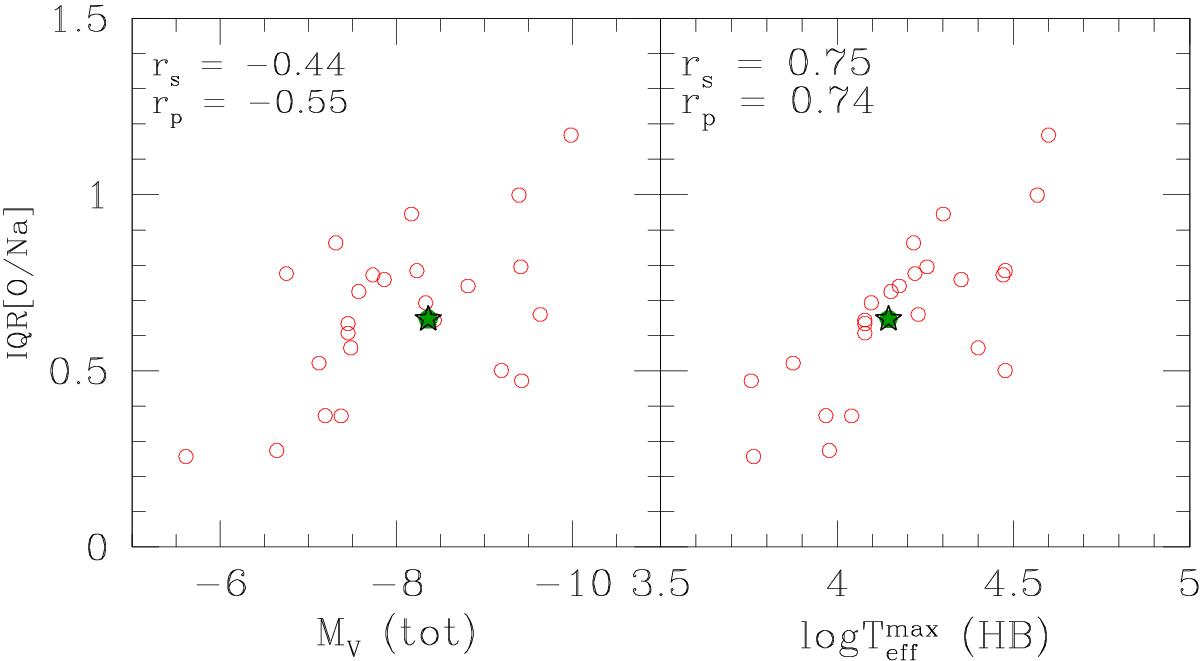
Left panel: correlation between total absolute magnitude and the interquartile range of the [O/Na] ratio for GC in our FLAMES survey (Carretta et al. 2009a, 2010b, 2011a, 2013b, 2014b, 2015, and references therein). Right panel: relation between the maximum temperature along the HB (Recio-Blanco et al. 2006; Carretta et al. 2007) and IQR[O/Na]. In each panel NGC 6139 indicated by a filled green star. The Spearman rank correlation coefficient rs and the Pearson linear correlation coefficient rp are listed in each panel.
Current usage metrics show cumulative count of Article Views (full-text article views including HTML views, PDF and ePub downloads, according to the available data) and Abstracts Views on Vision4Press platform.
Data correspond to usage on the plateform after 2015. The current usage metrics is available 48-96 hours after online publication and is updated daily on week days.
Initial download of the metrics may take a while.