Fig. 2
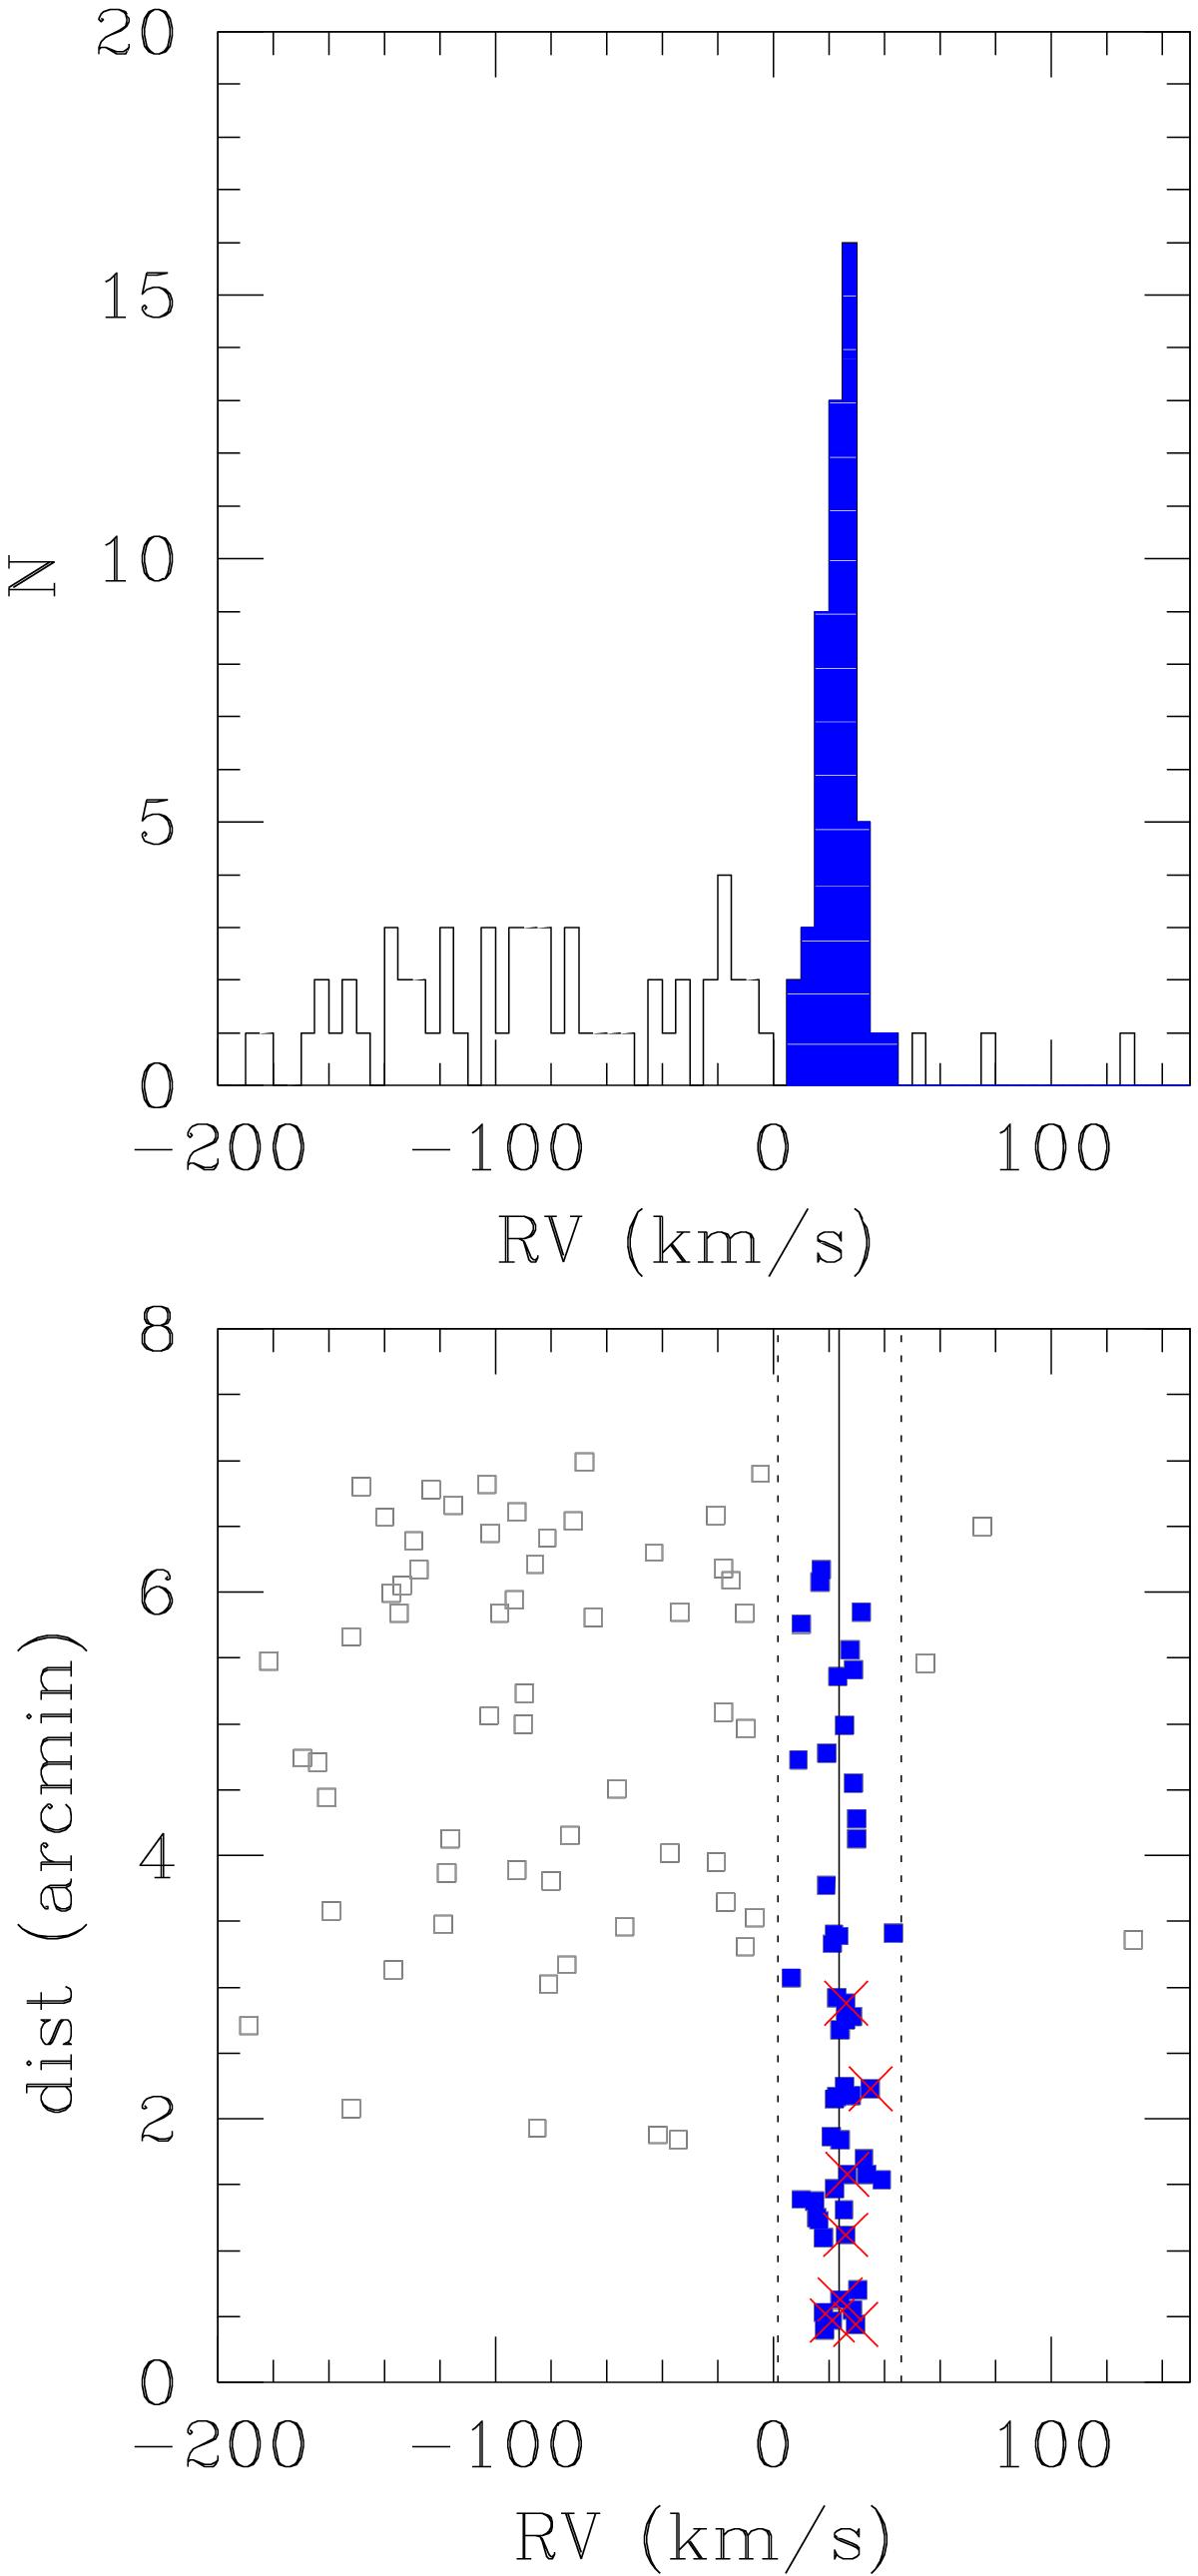
Upper panel: histogram of all measured RVs (open histogram) and of the candidate member stars alone (blue filled histogram). Lower panel: RVs versus distance from the cluster centre. The candidate member stars are indicated by filled blue squares, the UVES targets by large red crosses, and the lines indicate the cluster mean RV and the ± 3σ interval.
Current usage metrics show cumulative count of Article Views (full-text article views including HTML views, PDF and ePub downloads, according to the available data) and Abstracts Views on Vision4Press platform.
Data correspond to usage on the plateform after 2015. The current usage metrics is available 48-96 hours after online publication and is updated daily on week days.
Initial download of the metrics may take a while.