| Issue |
A&A
Volume 583, November 2015
|
|
|---|---|---|
| Article Number | A82 | |
| Number of page(s) | 9 | |
| Section | Atomic, molecular, and nuclear data | |
| DOI | https://doi.org/10.1051/0004-6361/201526567 | |
| Published online | 30 October 2015 | |
Radiative rates and electron-impact excitation for the n ≤ 6 fine-structure levels in H-like ions with 13 ≤ Z ≤ 42⋆
1
Applied Ion Beam Physics Laboratory, Fudan University, Key Laboratory of the Ministry of
Education, PR China
e-mail: This email address is being protected from spambots. You need JavaScript enabled to view it.
2
Shanghai EBIT Lab, Institute of Modern Physics, Department of
Nuclear Science and Technology, Fudan University, 200433
Shanghai, PR
China
3
Institute of Applied Physics and Computational
Mathematics, 100088
Beijing, PR
China
4
Center for Applied Physics and Technology, Peking
University, 100871
Beijing, PR
China
Received: 21 May 2015
Accepted: 6 August 2015
Abstract
Context. Many observed emission lines from space missions are due to highly charged H-like ions. An analysis of the lines provides information on the temperature, density, and chemical composition of plasmas. A wide range of atomic parameters, such as energy levels, radiative rates, and excitation rate coefficients are needed to achieve this goal.
Aims. In this paper we report on calculations for energy levels, radiative rates, collision strengths, and effective collision strengths for transitions among the 36 lowest levels of the n ≤ 6 configurations of highly charged H-like ions with 13 ≤ Z ≤ 42.
Methods. The widely used Flexible Atomic Code (FAC) is adopted for the calculation. Energy levels and radiative rates are calculated within the relativistic configuration-interaction method. Employing relativistic distorted-wave approximation, direct excitation collision strengths are calculated at eleven scattered electron energies E′f = 0.001, 0.002, 0.005, 0.01, 0.02, 0.05, 0.1, 0.2, 0.5, 1.0, and 2.5, where E′f is in units of Z2 rydbergs. Collision strengths at higher energies are estimated by interpolation/extrapolation using relativistic Bethe form. Resonance contributions through the relevant He-like doubly excited n′l′n′′l′′ configurations with n′ ≤ 7 and n′′ ≤ 75 are explicitly taken into account using the independent-process isolated-resonance approximation. Radiation damping effects are taken into account.
Results. We present the radiative rates, oscillator strengths, and line strengths for all electric dipole (E1), magnetic dipole (M1), electric quadrupole (E2), magnetic quadrupole (M2), electric octupole (E3), and magnetic octupole (M3) transitions. Assuming a Maxwellian electron velocity distribution, we report effective collision strengths over a wide temperature range between 2 × 10³ × Z2 and 2 × 10⁶ × Z2 K. We believe that the present results are the most extensive and definitive atomic dataset to date for highly charged H-like ions.
Key words: atomic data / atomic processes
Full Tables 1–4 are available at the CDS via anonymous ftp to cdsarc.u-strasbg.fr (130.79.128.5) or via http://cdsarc.u-strasbg.fr/viz-bin/qcat?J/A+A/583/A82
© ESO, 2015
1. Introduction
Emission and absorption lines of hydrogen and hydrogen-like ions have been observed in various astrophysical objects (Dere et al. 2001; Landi et al. 2006; Malespin et al. 2011; Schlegel et al. 2014). These lines provide valuable information about composition, density, and temperature of the emitting plasmas. To interpret the lines, a large amount of atomic data, including energy levels, transition probabilities, and electron impact excitation (EIE) rates are needed. These data are also required for the study of power loss in fusion reactors.
In the last decades, a number of ab initio calculations have been performed on electron impact excitation for H-like ions using various approximations. The works before 1994 have been reviewed in Callaway (1994). Of particular note are a series of studies performed by Aggarwal and his co-researchers. Employing a non-relativistic R-matrix approach, Aggarwal et al. reported the ordinary (Ω) and effective (Υ) collision strengths for the transitions among the 15 lowest LS terms of the n ≤ 5 configurations of C5+ (Aggarwal & Kingston 1991a), Ne9+ (Aggarwal & Kingston 1991b), Al12+ (Aggarwal et al. 2001), Si13+ (Aggarwal & Kingston 1992a), Ca19+ (Aggarwal & Kingston 1992b), and Fe25+ (Aggarwal & Kingston 1993). A number of the above non-relativistic R-matrix calculations are still included in the current CHIANTI database (Dere et al. 2001; Landi et al. 2013). Unfortunately, it was found that there were significant inconsistencies between the collision strengths from the above calculations for some transitions in several ions (Dere et al. 2001). Thus, new calculations for these transitions have been suggested.
Recently, employing the Dirac atomic R-matrix code (DARC), Aggarwal et al. have presented the values of Ω and Υ for the 300 transitions among the 25 lowest fine-structure levels of the n ≤ 5 configurations of C5+, N6+, O7+, F8+, Ne9+, and Na10+ (Aggarwal et al. 2010), Al12+ (Aggarwal et al. 2005, 2008c), Si13+ (Aggarwal & Keenan 2010), Ar17+ (Aggarwal et al. 2008a), and Fe25+ (Aggarwal et al. 2008b). These calculations represent significant improvements over their previous works. However, there may be some deficiencies in the above calculations. First, radiation damping effects on resonance excitation (RE) have been discarded in all the calculations. Second, as pointed out by Aggarwal et al. (see, e.g., Aggarwal et al. 2010) themselves, their effective collision strengths for transitions involving the levels of the n = 5 configurations could be improved by inclusion of the n = 6 configurations in the scattering calculation because of the additional resonances attached to the n = 6 levels. Third, because of the difficulty in calculating the Ω-value at high incident energy in the above calculations, the Υ-values have been tabulated at temperatures well below the peak of the coronal fractional abundance of H-like ions. For example, the Υ-values for Ar17+ (Aggarwal et al. 2008a) and Fe25+ (Aggarwal et al. 2008b) are reported at temperatures up to log Te(K) = 7.4 and log Te(K) = 7.7, while the peak of the fractional abundance of Ar17+ and Fe25+ are around log Te(K) = 7.6 and log Te(K) = 8.1 (Bryans et al. 2006), respectively. It should be mentioned that the LS values of Υ in Aggarwal & Kingston (1991a,b, 1992a,b, 1993), Aggarwal et al. (2001) were given at even lower temperatures. This could limit the use of the above atomic data calculated by Aggarwal et al. in high-temperature plasma.
Ballance et al. (2002) performed an R-matrix calculation for transitions among the n ≤ 5 levels in Fe25+ with close attention to both high-energy behavior of collision strength and radiation damping, employing the semirelativistic intermediate coupling frame transformation (ICFT) method. Malespin et al. (2011) reported similar DARC calculations to those performed by Aggarwal et al. (Aggarwal et al. 2010, 2005, 2008c,a,b; Aggarwal & Keenan 2010) for highly charged H-like ions of Fe-peak elements with nuclear charge number Z = 24−28, but including radiation damping effects. It was confirmed that radiation damping plays a prominent role for certain near-threshold resonances (Ballance et al. 2002; Malespin et al. 2011). In addition, the relativistic effects are significant. The DARC results show an increase in the background excitation cross section of about 10% compared with the ICFT results also provided in Malespin et al. (2011).
It has been shown in Ballance et al. (2002) that the Ω-value at scattered energy of about five/three times electron temperature (kTe in eV) for (electric) dipole-allowed/forbidden transitions is needed to obtain converged Υ-values at a temperature of kTe, respectively. In general, Bethe’s form (Bethe 1930; Inokuti 1971) of the non-relativistic plane-wave Born approximation (PWBA) is employed to estimate the needed high-energy collision strengths. To achieve this goal in modern R-matrix calculations, the C-plot scaling method proposed by Burgess & Tully (1992) for dipole-allowed transitions and the extension work (Burgess et al. 1997) for high-energy limits of Born approximation for dipole-forbidden transitions have been widely used, as was done in Ballance et al. (2002), Malespin et al. (2011). In short, the extrapolation methods are in principle based on the non-relativistic high-energy asymptotic behaviors of Ω ~ const. × ln(Ei) for dipole-allowed transitions and Ω ~ const. for dipole-forbidden transitions (Burgess & Tully 1992), in which Ei is the incident electron energy. However, as pointed out by Malespin et al. (2011), in such extrapolations, care must be taken to ensure that the collision strength has approached its non-relativistic asymptotic limit sufficiently before extrapolating to the infinite limit point, or there is a danger of grossly underestimating/overestimating the Υ-value at high temperature. This kind of deficiency occurs mainly because one parameter “C” has to be introduced in the extrapolation (Burgess & Tully 1992).
One should keep in mind that relativistic asymptotic behavior of collision strength (or, equivalently cross section) rather than non-relativistic one does happen when the velocity of incident electron increases, eventually approaching relativistic energies. In recent years, many works have been carried on for EIE in high energy region, for example see (Fontes & Zhang 2007, 2014a,b, 2015; Bostock et al. 2013; Zhang & Fontes 2013, 2015; Bostock et al. 2009; Gumberidze et al. 2013; Najjari & Voitkiv 2013; Chen et al. 2014). Of particular interest is a series of works performed by Fontes & Zhang, and their co-workers (Fontes & Zhang 2007, 2014a,b, 2015; Bostock et al. 2013; Zhang & Fontes 2013, 2015). Fontes & Zhang (2007) reported an exact treatment of the relativistic plane-wave Born (RPWB) EIE cross section for an arbitrary atom or ion in which only the Coulomb interaction between the bound and free electrons was considered. In a further study performed by Bostock et al. (2013), the Møller interaction (Møller 1932) was also included in the exact treatment of RPWB approximation and employed in the relativistic convergent close-coupling method (Fursa & Bray 2008). In Fontes & Zhang (2007), Bostock et al. (2013) an improved “top-up” method for obtaining an accurate high-l partial-wave contribution was given. Owing to the full treatment of relativistic effects and inclusion of the Møller interaction, this method could allow the EIE cross sections to be calculated to arbitrarily high energies (Bostock et al. 2013). Subsequently, Fontes and Zhang included the improved top-up method in the famous relativistic distorted-wave (RDW) code originally developed by Sampson et al. (2009) and systematically re-calculated the direct excitation (DE) cross sections at high energy for the Δn = 0 transitions among the levels arising from the n = 2 configurations in Be- through O-like highly charged ions (Zhang & Fontes 2013, 2015; Fontes & Zhang 2014a,b, 2015), which had already been studied by Zhang and Sampson (Zhang & Sampson 1992, 1994, 1996, 1999, 2002) using the same code, but instead employing the Coulomb-Bethe approximation to account for the high-l partial-wave contribution. Fontes and Zhang concluded that their results (Zhang & Fontes 2013, 2015; Fontes & Zhang 2014a,b, 2015) were more accurate than those in the references (Zhang & Sampson 1992, 1994, 1996, 1999, 2002). In addition, they pointed out that their RDW values (especially for dipole-allowed transitions) at high energy, where resonance excitation (RE) is not present and a fully relativistic description of the continuum electrons is warranted, should be more reliable than those calculated by R-matrix methods in which the non-relativistic top-up methods of Coulomb-Bethe approximation were generally employed to account for the high-l partial-wave contributions (as was done in all the above mentioned R-matrix calculations) and the Møller interaction was not taken into account either. They also mentioned that the effect of resonances can be accurately included for the case of highly charged ions via independent-process and isolated-resonance approximation using distorted-wave (denoted the IPIRDW approximation; Sampson et al. 2009).
We have previously performed a large-scale calculation of EIE among the 36 lowest fine-structure levels arising from the n ≤ 6 configurations for Fe25+ (Chen et al. 2010), employing the widely used Flexible Atomic Code (FAC; Gu 2003, 2008). Collision strengths for DE are calculated with the RDW approximation. Resonance excitations are dealt with using the IPIRDW approximation. We have discussed extensively the behavior of collision strength at high temperature and employing the relativistic Bethe form (Bethe 1932) to reliably obtain the needed high-energy Ω-value. The deficiency of extrapolation in the C-plot method has been removed in our method. It allow us to present reliable Υ-values at electron temperatures of 109 K or even higher. Our Υ-values at relatively low temperature are in good agreement with the DARC (Aggarwal et al. 2008b) and ICFT (Ballance et al. 2002) results for most of the transitions if both the target size and the way of treating radiation damping are kept identical. These good agreements have also been confirmed by the follow-up DARC and ICFT calculations performed by Malespin et al. (2011). However, our Υ-values in the high temperature region are generally larger than the R-matrix values (Aggarwal et al. 2008b; Ballance et al. 2002; Malespin et al. 2011) owing to the full treatment of relativistic effects and the inclusion of the Møller interaction in our work. It also shows that the weak transitions towards or among the n = 5 levels are enhanced significantly by resonances attached to the n = 6, 7 levels. To our knowledge, these enhancements have not been included in any published R-matrix calculations for EIE in highly charged H-like ions.
Here we perform the same calculations as in Chen et al. (2010), but for 29 additional H-like highly-charged ions with nuclear charge number Z in the range 13 ≤ Z ≤ 42. For completeness, the atomic data will be available for all the ions with Z in the range 13 ≤ Z ≤ 42, including the published Fe XXVI data. It should also be mentioned that there has been almost no R-matrix calculation including the n = 6 levels while the cascading effects from them were emphasized by Smith et al. (2001). In the following sections, we outline the calculation procedure, present our results, and discuss them. The details of our calculations can be found in Chen et al. (2010).
2. Calculation procedure and results
In the present work, all atomic data are calculated using the latest version (1.1.1) of the FAC code (Gu 2003, 2008). FAC is a fully relativistic program computing both structure and scattering data. It uses a modified Dirac-Fock-Slater central-field potential that includes an approximate treatment of the exchange interaction. The orbitals are optimized in a self-consistent field (SCF) iterative procedure during which the average energy of a fictitious mean configuration with fractional orbital occupation numbers is minimized. This mean configuration represents the average electron cloud of the configurations retained in the configuration-interaction (CI) expansion. Relativistic effects are fully considered using the Dirac-Coulomb Hamiltonian. Higher order QED effects are included with the Breit interaction in the zero-energy limit for the exchanged photon, and hydrogenic approximations for self-energy and vacuum polarization effects. The resulting CI wave-functions are then used to obtain the atomic data, such as radiative and autoionization rates, and collision strengths via either the RDW approximation or the Dirac R-matrix method (Gu 2004).
Energy (in eV) and lifetime (τ, in s) for the 36 lowest levels of H-like ions with 13 ≤ Z ≤ 42. a ± b≡ a × 10± b.
The n ≤ 6 configurations in H-like ions give rise to 36 fine-structure levels, which are listed in Table 1. In the CI calculation, the electron correlations among these 36 levels are taken into account. The levels are identified by their dominant components in the j − j coupling basis set. The lifetimes (τ) are also listed in Table 1. All electric dipole (E1), magnetic dipole (M1), electric quadrupole (E2), magnetic quadrupole (M2), electric octopole (E3), and magnetic octopole (M3) transitions among the 36 levels are taken into account in the lifetime calculation. As shown in Chen et al. (2010), the E1 transitions predominate the lifetime, except for 2s1/2, for which the two-photon transition rates (Drake 1986; Santos et al. 1998) should be considered. The detailed E1, M1, E2, M2, E3, and M3 transition rates (Ar) are listed in Table 2, together with the corresponding wavelengths (λ), absorption oscillator strengths (f), and line strengths (S). The numerical conversion formulae among these atomic parameters can be found in the literature (see, e.g., Safronova et al. 2006). The indices used to represent the lower and upper levels of a transition in Table 2 and elsewhere are defined and listed in Table 1.
Wavelength (λ, in Å), radiative rate (Ar, in s-1), absorption oscillator strength (f, dimensionless), and line strength (S, in au) for transitions in H-like ions with 13 ≤ Z ≤ 42. TP stands for the type of transition, and a ± b≡ a × 10± b.
Calculation of DE collision strength (Ω) can be straightforwardly performed within the FAC computer package (Gu 2008), employing relativistic distorted-wave approximation (RDWA). As was done in Chen et al. (2010), we set the maximum orbital angular momentum (l) for the partial-wave expansion to 75 to ensure the convergence of the collision strengths. Higher partial-wave contributions are included using the Coulomb-Bethe approximation. The partial waves with l> 20 are treated with quasi-relativistic approximation (Zhang et al. 1989). Correlations among the n ≤ 6 configurations in H-like ions are taken into account. The values of Ω for all 630 transitions among the 36 lowest levels have been calculated at eleven scattered electron energies  , 0.002, 0.005, 0.01, 0.02, 0.05, 0.1, 0.2, 0.5, 1.0, and 2.5, where
  is in units of Z2 Ry. For brevity, we only list the values of Ω at
  , 0.1, 0.2, 0.5, 1.0, and 2.5 in Table 3.
Collision strengths (Ω) for transitions in H-like ions with 13 ≤ Z ≤ 42.  in Z2 Ry and a ± b≡ a × 10± b.
Transition energy (Eij, in eV), radiative decay rate ( , in s-1), and effective collision strength (Υ) for transitions in H-like ions with 13 ≤ Z ≤ 42.
  in 1000 × Z2 K and a ± b≡ a × 10± b.
DE effective collision strengths (Υ) are obtained after integrating Ω over a Maxwellian distribution of electron velocities, i.e., 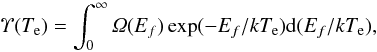 (1)where k is the Boltzmann constant and Te is the electron temperature in K. The rate coefficients can be obtained from the relation between the Υ-values (see Eq. (3)). The values of kTe, where the fractional abundances for H-like highly charged ions in collisional plasma peak, are (in energy units) ~ Z2 Ry (Bryans et al. 2006). For higher Te, even above ten times Z2 Ry, the fractional abundances are still noticeable. The present RDWA Ω values can guarantee the convergence of Maxwellian integration in Eq. (1) for kTe up to about 0.5 × Z2 Ry. The values of Ω at several tens of Z2 Ry have to be evaluated to guarantee the convergence of Υ at higher kTe, especially for dipole-allowed transitions. We describe how to obtain the needed high-energy Ω-value in detail in the next section.
The RE contributions are calculated in the IPIRDW approach, in which the excitation from state i to j of of H-like ions is treated as a two-step process, dielectronic capture forming a He-like doubly excited state d, which is followed by autoionization into state j. The RE contributions to the rate coefficient is expressed as 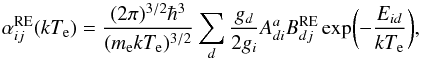 (2)where Eid is the resonant energy,
  is the Auger rate from d to i,
  is the Auger decay branching ratio from state d to state j, and gi and gd are the statistical weights of states i and d, respectively. One can find more details about the RE calculations from (Shen et al. 2007a,b, 2009; Zhang et al. 2009; Chen et al. 2010; Wang et al. 2011, 2012).
As in Chen et al. (2010), here the RE contributions through the relevant He-like doubly excited configurations n′l′n′′l′′ with l′ ≤ n′ − 1 and l′′ ≤ 8 are included explicitly up to n′ = 7 and n′′ = 75. The higher-n′′ contributions are included up to n′′ = 200 by using the (n′′)-3 scaling law (Shen et al. 2007a,b). For H-like ions, the electron correlations among the n ≤ 6 configurations are considered. For He-like ions, configuration interaction within the same complex are taken into account. The resonant stabilizing (RS) transitions from the doubly excited configurations n′l′n′′l′′ towards 1sn′′l′′ and 1sn′l′ are considered as a radiation damping source. Decays from the resonances into low-lying autoionizing levels possibly followed by autoionization cascade (DAC) are also taken into account. Here all possible DAC transitions n′l′ → n′′′l′′′ (n′′′<n′) are included. The DAC transitions from the n′′l′′ electron to n′′′l′′′ with n′′′ ≤ 9 are also considered. Basic atomic data, such as energy levels, and radiative and Auger rates, are also calculated employing the FAC code. Only E1 transitions from the doubly excited states are included as a radiation damping source. In addition, all possible autoionization channels of the doubly excited states are taken into account.
The total effective collision strengths including both DE and RE contributions are listed in Table 4. The Υ-values are listed at ten electron temperatures between 2 × 10³ × Z2 K and 2 × 10⁶ × Z2 K. The statistical weights, spontaneous radiative decay rates between the lower and upper levels, and the energy differences are also included in Table 4. Thus, this table is self-contained for a spectral calculation using collisional radiative model (CRM).
The excitation qij and de-excitation qji rate coefficients (in cm3 s-1) can be determined straightforwardly using Υ from the relations 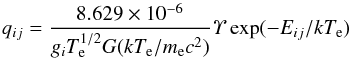 (3)and
 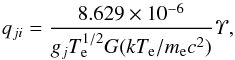 (4)where gi and gj are the statistical weights of the initial (i) and final (j) states; Eij is the energy difference between levels i and j; and G(kTe/mec2) is a relativistic corrective factor. For kTe/mec2< 1, which is generally true for most cases of interest, it is given by Zhang & Fontes (2013, 2015), Fontes & Zhang (2014a,b, 2015)
 (5)where x = kTe/mec2. The above factor can generally be approximated to unity at relatively low temperatures, which is true for most cases in the literature (see, e.g., Aggarwal et al. 2008a,b).
3. Discussions
Because of the simplicity of the atomic structure, the present level energies tabulated in Table 1 are higher by only 8–15 ppm than the values listed in the NIST Atomic Spectra Database1. The present radiative rates for E1, M1, E2, M2, E3, and M3 multipole transitions are in excellent agreement with those reported by Aggarwal et al. (Aggarwal et al. 2010, 2005, 2008c,b,a; Aggarwal & Keenan 2010) to within 2% for most Δn ≠ 0 transitions, but with a few exceptions for M1 transitions as stated in Chen et al. (2010). In addition, we have also compared our rates with those in Jitrik & Bunge (2004). Agreements to within 1% are found for most of the transitions. We can state with confidence that our rates should be accurate to within 1% for strong E1 transitions.
As mentioned above, to guarantee the convergence of Υ at temperatures above 0.5 × Z2 Ry, the high-energy Ω-value is needed. The C-plot scaling method proposed by Burgess & Tully (1992), which is based on the non-relativistic asymptotic behaviors of high-energy Ω-values, has been widely used in modern R-matrix calculations (see e.g. Ballance et al. 2002; Malespin et al. 2011). As done in Chen et al. (2010), the present high-energy Ω-value is estimated by employing relativistic asymptotic behaviors. According to the discussions (Inokuti 1971; Bartiromo et al. 1985), we may define the reduced cross section Q as 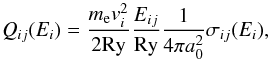 (6)where me is the rest mass of the electron, vi the velocity of the incident electron, and Eij the excitation energy. In the relativistic region, a Fano-plot of the reduced cross sections Qij for dipole-allowed transitions against ln [ β2/ (1 − β2) ] − β2 (in which β = vi/c, c is the light velocity) will become a straight line, whose slope corresponds to the optical oscillator strength fij. For dipole-forbidden transitions, Qij will become nearly a constant against ln [ β2/ (1 − β2) ] − β2 (Inokuti 1971). We thus have
 ![Mathematical equation: \begin{equation} \label{eq:allowed} Q_{ij}(E_i) = f_{ij} \times \left \{ \mathrm{ln} [\beta^2/(1-\beta^2)]-\beta^2 \right \} + A \end{equation}](/articles/aa/full_html/2015/11/aa26567-15/aa26567-15-eq573.png) (7)for dipole-allowed transitions, and
(7)for dipole-allowed transitions, and 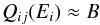 (8)for dipole-forbidden transitions. The parameters A and B can be estimated from the Fano-plot or calculated directly using RPWB approximation (Inokuti 1971).
Using relativistic Bethe formulae (Bethe 1932), see Eqs. (7) and (8), we have calculated Ω-values at  , 30, and 100. The RDWA Ω values at
  are then smoothly connected with the Bethe results by splines. For instances, Fig. 1 shows the Fano-plots for some selected transitions in Si13+. As also shown in Chen et al. (2010) for transitions in Fe25+, the needed high-energy Ω-values can be reliably obtained by interpolation/extrapolation from the Fano-plot. Here we explicitly calculate the Υ of direct excitation at electron temperatures up to 2 × 10⁶ × Z2 K (about 12.7 × Z2 Ry). It should be pointed out that the present Υ-values in the high-energy region are generally higher than those based on the non-relativistic Bethe form (Ballance et al. 2002; Malespin et al. 2011). Compared to the C-plot extrapolation method, the present method employing the Fano-plot does not need any additional parameters to match the low-energy Ω to the infinite limit point. We hope the same method can be used to extrapolate the high-energy Ω-value in future DARC calculations.
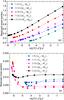 |
Fig. 1 Reduced excitation cross sections of some selected a) dipole-allowed and b) forbidden transitions in Si13+. The values at the three highest energies for each transition are obtained by the relativistic Bethe form. The scattered symbols are connected with splines. |
Using the Lawrence Livermore National Laboratory SuperEBIT electron beam ion trap facility, Thorn et al. (2009) measured the EIE cross section for 1s1/2 − 2p3/2 transition in H-like iron and nickel over a broad range of energies (30−90 keV). The present cross sections agree well with the results from Thorn et al. (2009) to within 13% and 8% for H-like iron and nickel, respectively, as shown in Fig. 2 for Ni27+.
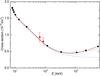 |
Fig. 2 Cross section in the high-energy region for 1s1/2 − 2p3/2 transition in Ni27+. Squares connected by splines show the present results. Values for the five highest energies are calculated by relativistic Bethe form. Dashed and dotted lines are the Møller-Kummer and Coulomb-Kummer results calculated in Bostock et al. (2013), respectively. Circles with error bars are experimental values from Thorn et al. (2009). |
In Fig. 2 are also shown those results calculated by Bostock et al. (2013) employing the exact RPWB approximation with and without Møller interaction (referred to as Møller-Kummer and Coulomb-Kummer results in Bostock et al. 2013, respectively) to account for the high-l partial-wave contributions. It shows the spline could reproduce well the high-energy cross section, and it presents results that are in better agreement with the Coulomb-Kummer values at incident electron energy below 100 keV than with the Møller-Kummer values. This is due to the fact that in our explicit RDW calculations for  (about 26.7 keV in Ni27+) the Møller interaction has not been taken into account. Fortunately, the uncertainties of the present RDW results introduced by discarding the Møller interaction could be estimated to be less than 5% for the ions (13 ≤ Z ≤ 42) considered here. This estimation could be drawn from Fig. 3 in Bostock et al. (2013) in which the cross sections for 1s1/2 − 2p3/2 transitions in Xe53+ calculated by a variety of methods were given. Comparing the results denoted in Bostock et al. (2013) as Coulomb-Kummer and Møller-Kummer, Fontes+Zhang-Coulomb-RDW, and Fontes+Zhang-GBI-RDW, the differences are less than 5% for incident electron energy below 100 keV. In fact, we have performed a test calculation for this transition employing FAC. Our results are confirmed as being in agreement with the Møller-Kummer or Fontes+Zhang-GBI-RDW results (both including the Møller interaction) in Bostock et al. (2013) to within 5%.
Above 200 keV the present relativistic Bethe cross section is in better agreement with the Møller-Kummer results than with the Coulomb-Kummer ones from Bostock et al. (2013), while the latter diverges progressively from the two former ones owing to the famous Bethe rise (Bethe 1932) caused by the inclusion of the Møller interaction. In the extremely high-energy region (above 2.0 MeV), the relativistic Bethe results also diverge from the Møller-Kummer values. As discussed in Bostock et al. (2013), it is obviously because Bethe (1932) did not try to deal with the exact RPWB matrix elements of the Møller interaction, but employed various approximations, such as (i) the dipole approximation in the scattering amplitude; (ii) setting spinor matrix elements of Dirac α matrices to v/c; and (iii) capitalizing on the fact that small momentum transfer (forward scattering) dominates for high-impact energies, which allowed analytic simplification of the integrated cross-section formula. Fortunately, the deviations between the relativistic Bethe cross section and the Møller-Kummer values are still no more than 5% in the energy range below 1.0 MeV. As mentioned before, we present here Υ-values at kTe up to about 12.7 × Z2 Ry, being around 135 keV in case of Ni27+. The Ω-value at energy only up to 675 keV is needed to guarantee the convergence of Υ. Thus, it is reasonable to expect that it would not introduce a large uncertainty into the Υ-value given in this paper by employing the relativistic Bethe form rather than using an exact RPWB approximation. However, more calculations as performed in Bostock et al. (2013) for other transitions would be very useful in order to verify the accuracy of our Υ-value in the high-temperature region.
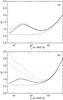 |
Fig. 3 Radiative damping effects on effective collision strength (ΥZ2) of 2−6(2p1/2 − 3s1/2) transition in a) Si13+ and b) Kr35+. The dashed line represents the direct excitation (DE) background contribution. The dotted line is undamped Υ results including the resonance excitation (RE) contribution. The dash-dotted line is damped results by resonant stabilizing (RS) transitions. The solid line stands for total Υ-values damped by both RS and DAC (Decays from the resonances into low-lying autoionizing levels possibly followed by autoionization cascade) transitions. |
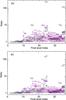 |
Fig. 4 Ratios of the total of DE and RE effective collision strengths at Te = 5 × 100Z2 K with considerations of both RS and DAC transitions to the DE values are plotted against the final state indices of the excitations. The squares, circles, triangles, diamonds, and crosses are for the excitations initially from level keys 1−4, and others, respectively. a) Si13+ and b) Kr35+. |
In our recent work on EIE in H-like Fe25+ (Chen et al. 2010) and other ions (Wang et al. 2012, 2011; Shen et al. 2007a,b, 2009; Zhang et al. 2009), we have extensively studied radiation damping effects due to inclusion of both RS and DAC decays from resonances. It was found that 2pn′′l′′ resonances could be completely damped out by strong inner 2p − 1s RS transitions while n′l′n′′l′′ (n′> 2) resonances could be significantly damped out by DAC transitions. Here, we have obtained similar results. For example, in Fig. 3 the total effective collision strengths of 2−6 (2p1/2 − 3s1/2) excitation in Si13+ and Kr35+, considered with and without radiation damping, are plotted. It shows that RS transitions reduce the effective collision strength of the 2−6 transition in Si13+ and Kr35+ by 10% and 24% at 500Z2 K while the reductions due to the inclusion of additional DAC transitions together with RS values are about 34% and 76%, respectively. The strong 3dn′′l′′ − 2pn′′l′′ and 3pn′′l′′ − 2sn′′l′′ DAC transitions account for these damping effects. These significant reductions are also found for other n = 2−3 transitions along the whole isoelectronic sequence. At higher temperatures, the radiation damping effects are smaller owing to smaller enhancements from resonance excitation. In addition, it should be noted that the radiation damping effects are more significant as the nuclear charge number increases. In the case of Mo41+, the RE contributions at relatively high temperatures could be completely damped out.
To show the overall importance of RE, in Fig. 4 we plot the ratios of the total effective collision strengths (DE plus RE) to those only from DE at 5 × 100Z2 K. It turns out that the inclusion of the RE contributions can enhance the DE effective collision strengths at 500Z2 K by over 50% for 56% and 34% out of the total 630 transitions among the 36 lowest fine-structure levels in Si13+ and Kr35+, respectively. The largest enhancements (up to approximately two orders of magnitude) occur for the transitions towards the high-lying levels with large orbital angular momentum, such as 4f5/2;7/2, 5g7/2;9/2, and 6h9/2;11/2. As argued in Chen et al. (2010), there are two factors that account for these large enhancements. First, the resonance states prefer to decay towards these final states owing to their large statistical weights. Second, the background collision strengths for these transitions (especially for transitions initially from the ground state) are very small. We note that the resonances attached to the n′ = 6,7 levels contribute significantly (up to approximately two orders of magnitude) to the total effective collision strengths of certain transitions to and among the n = 5,6 levels, such as 1s1/2 − 5g7/2;9/2 and 1s1/2 − 6h9/2;11/2. At higher temperature, the RE enhancements at 50 × 100Z2 K become smaller, being over 50% for 19% and 11% transitions in Si13+ and Kr35+, respectively.
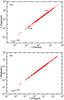 |
Fig. 5 Comparision of the present effective collision strengths with a) undamped DARC values for Si13+ (Aggarwal & Keenan 2010) at 107.0 K and b) the damped DARC for Ni27+ (Malespin et al. 2011) at 108.2 K. |
The present results for Fe25+ have been extensively compared with the undamped DARC (Aggarwal et al. 2008b) and damped ICFT (Ballance et al. 2002) results in Chen et al. (2010). Our undamped FAC effective collision strengths are very close to the undamped DARC calculation of Aggarwal et al. (2008b), indicating that a fully relativistic distorted-wave calculation that includes resonant excitation can provide accurate excitation data for highly charged H-like ions. Because of incomplete treatment of relativistic effects, the ICFT (Ballance et al. 2002) results generally differ from ours by 10%, especially for the transitions initially from the ground 1s1/2 level. The above conclusions are confirmed by the follow-up DARC and ICFT calculations performed by Malespin et al. (2011). Here, for brevity we do not try to give extensive comparisons (as done in Chen et al. 2010) of our results for other H-like ions with the published R-matrix calculations. We only give the comparisons in Fig. 5 of the present Υ-values of Si13+ at 107.0 K and Ni27+ at 108.2 K with the results from undamped DARC (Aggarwal & Keenan 2010) and damped DARC (Malespin et al. 2011) calculations. It shows that the agreements to within 10% are for 73% and 84% out of 300 transitions among the 25 lowest levels arising from n ≤ 5 configurations in Si13+ and Ni27+. For some weak transitions to or among the n = 5 levels, our IPIRDW results could be larger than the DARCs by over 20%. For very weak transitions 1s − 5g7/2,9/2 our Υ-values are higher by a factor of 9, as shown in Fig. 5. The above differences are mainly due to the additional inclusion of RE contributions from the resonances attached to the n = 6,7 levels in the present IPIRDW calculations. It should be mentioned that in the high-temperature region the DARC Υ-value for transition 6−9 (3s1/2 − 3d5/2) is abnormally higher than our IPIRDW results, as seen from Fig. 5a.
4. Conclusions
In conclusion, we report here the results for energy levels, radiative rates, lifetimes, collision strengths (or equivalently, cross sections), and effective collision strengths for all transitions among the 36 lowest levels belonging to the n ≤ 6 configurations of highly charged H-like ions with 13 ≤ Z ≤ 42, employing the FAC computer package. Results for E1, E2, E3, M1, M2, and M3 transitions are presented. Collision strengths are calculated by employing the relativistic distorted-wave approximation. The high-energy behavior of cross section is analyzed. It shows that the high-energy collision strength can be evaluated reliably through interpolation/extrapolation by employing the relativistic Bethe form, in which the Møller interaction could be suitably taken into account. Employing the Fano-plot of cross section, we can reliably evaluate effective collision strengths at temperatures up to 2 × 10⁶ × Z2 K. In addition, our Υ-values in the high-temperature region are generally higher than the previously published R-matrix results. Resonances attached to the n ≤ 7 levels are taken into account by the IPIRDW approximation. Inclusion of resonant stabilizing transitions and decays to lower-lying autoionizing levels from the resonances significantly reduce the total effective collision strengths at low electron temperatures for some transitions. The resonances attached to the n = 6 and 7 levels are found to enlarge the effective collision strengths significantly at low temperature for transitions to and among the n = 5,6 levels. These enhancements have never been included in the published R-matrix calculations for highly charged H-like ions.
The present energy levels are assessed to be accurate to about 0.0015%. The accuracy of the present radiative rates of strong E1 transitions is probably better than 1%. Our effective collision strength is estimated to be accurate to about 20% over the whole electron temperature as both resonance excitation and relativistic behavior of high-energy cross sections have been considered. We believe the present results, which are also available at the journal’s Web Page as ASCII files, are the most comprehensive atomic dataset to date for highly charged H-like ions. We expect that these data will be extremely useful for the modeling of astrophysical and fusion plasmas.
Acknowledgments
This work is supported by National Natural Science Foundation of China under Grant Nos. 11076009, 11374062 and Chinese Association of Atomic and Molecular Data. It is also partially supported by National Magnetic Confinement Fusion Program with Grant No. 2009GB106001, and Shanghai Leading Academic Discipline Project under Grant No. B107.
References
- Aggarwal, K. M., & Kingston, A. E. 1991a, J. Phys. B, 24, 4583 [Google Scholar]
- Aggarwal, K. M., & Kingston, A. E. 1991b, Phys. Scr., 44, 517 [NASA ADS] [CrossRef] [Google Scholar]
- Aggarwal, K. M., & Kingston, A. E. 1992a, Phys. Scr., 46, 193 [NASA ADS] [CrossRef] [Google Scholar]
- Aggarwal, K. M., & Kingston, A. E. 1992b, J. Phys. B, 25, 751 [NASA ADS] [CrossRef] [Google Scholar]
- Aggarwal, K. M., & Kingston, A. E. 1993, ApJS, 85, 187 [NASA ADS] [CrossRef] [Google Scholar]
- Aggarwal, K. M., & Keenan, F. P. 2010, Phys. Scr., 82, 065302 [NASA ADS] [CrossRef] [Google Scholar]
- Aggarwal, K. M., Keenan, F. P., & Rose, S. J. 2001, Phys. Scr., 63, 95 [NASA ADS] [CrossRef] [Google Scholar]
- Aggarwal, K. M., Keenan, F. P., & Rose, S. J. 2005, A&A, 432, 1151 [NASA ADS] [CrossRef] [EDP Sciences] [Google Scholar]
- Aggarwal, K. M., Hamada, K., Igarashi, A., et al. 2008a, A&A, 487, 383 [NASA ADS] [CrossRef] [EDP Sciences] [Google Scholar]
- Aggarwal, K. M., Hamada, K., Igarashi, A., et al. 2008b, A&A, 484, 879 [NASA ADS] [CrossRef] [EDP Sciences] [Google Scholar]
- Aggarwal, K. M., Igarashi, A., Keenan, F. P., & Nakazaki, S. 2008c, A&A, 479, 585 [NASA ADS] [CrossRef] [EDP Sciences] [Google Scholar]
- Aggarwal, K. M., Keenan, F. P., & Heeter, R. F. 2010, Phys. Scr., 82, 015006 [NASA ADS] [CrossRef] [Google Scholar]
- Ballance, C. P., Badnell, N. R., & Berrington, K. A. 2002, J. Phys. B, 35, 1095 [NASA ADS] [CrossRef] [Google Scholar]
- Bartiromo, R., Bombarda, F., & Giannella, R. 1985, Phys. Rev. A, 32, 531 [NASA ADS] [CrossRef] [Google Scholar]
- Bethe, H. 1930, Ann. Phys., 3, 325 [NASA ADS] [CrossRef] [Google Scholar]
- Bethe, H. 1932, Z. Phys., 76, 293 [Google Scholar]
- Bostock, C. J., Fursa, D. V., & Bray, I. 2009, Phys. Rev. A, 80, 052708 [NASA ADS] [CrossRef] [Google Scholar]
- Bostock, C. J., Fontes, C. J., Fursa, D. V., Zhang, H. L., & Bray, I. 2013, Phys. Rev. A, 88, 012711 [NASA ADS] [CrossRef] [Google Scholar]
- Bryans, P., Badnell, N. R., Gorczyca, T. W., et al. 2006, ApJS, 167, 343 [NASA ADS] [CrossRef] [Google Scholar]
- Burgess, A., & Tully, J. A. 1992, A&A, 254, 436 [NASA ADS] [Google Scholar]
- Burgess, A., Chidichimo, M. C., & Tully, J. A. 1997, J. Phys. B, 30, 33 [NASA ADS] [CrossRef] [Google Scholar]
- Callaway, J. 1994, At. Data Nucl. Data Tables, 57, 9 [Google Scholar]
- Chen, C. Y., Wang, K., Huang, M., Wang, Y. S., & Zou, Y. M. 2010, J. Quant. Spectr. Radiat. Trans., 111, 843 [Google Scholar]
- Chen, Z. B., Dong, C. Z., Xie, L. Y., & Jiang, J. 2014, Phys. Rev. A, 90, 012703 [NASA ADS] [CrossRef] [Google Scholar]
- Dere, K. P., Landi, E., Young, P. R., & Zanna, G. D. 2001, ApJS, 134, 331 [NASA ADS] [CrossRef] [Google Scholar]
- Drake, G. W. F. 1986, Phys. Rev. A, 34, 2871 [NASA ADS] [CrossRef] [PubMed] [Google Scholar]
- Fontes, C. J., & Zhang, H. L. 2007, Phys. Rev. A, 76, 040703(R) [NASA ADS] [CrossRef] [Google Scholar]
- Fontes, C. J., & Zhang, H. L. 2014a, At. Data Nucl. Data Tables, 100, 802 [NASA ADS] [CrossRef] [Google Scholar]
- Fontes, C. J., & Zhang, H. L. 2014b, At. Data Nucl. Data Tables, 100, 1292 [NASA ADS] [CrossRef] [Google Scholar]
- Fontes, C. J., & Zhang, H. L. 2015, At. Data Nucl. Data Tables, 101, 143 [NASA ADS] [CrossRef] [Google Scholar]
- Fursa, D. V., & Bray, I. 2008, Phys. Rev. Lett., 100, 113201 [NASA ADS] [CrossRef] [Google Scholar]
- Gu, M. F. 2003, ApJ, 582, 1241 [NASA ADS] [CrossRef] [Google Scholar]
- Gu, M. F. 2004, Phys. Rev. A, 70, 062704 [NASA ADS] [CrossRef] [Google Scholar]
- Gu, M. F. 2008, Can. J. Phys., 86, 675 [NASA ADS] [CrossRef] [Google Scholar]
- Gumberidze, A., Thorn, D. B., Fontes, C. J., et al. 2013, Phys. Rev. Lett., 110, 213201 [NASA ADS] [CrossRef] [PubMed] [Google Scholar]
- Inokuti, M. 1971, Rev. Mod. Phys., 43, 297 [NASA ADS] [CrossRef] [Google Scholar]
- Jitrik, O., & Bunge, C. F. 2004, J. Phys. Chem. Ref. Data, 33, 1059 [NASA ADS] [CrossRef] [Google Scholar]
- Landi, E., Zanna, G. D., Young, P. R., et al. 2006, ApJS, 162, 261 [NASA ADS] [CrossRef] [Google Scholar]
- Landi, E., Young, P. R., Dere, K. P., Del Zanna, G., & Mason, H. E. 2013, ApJ, 763 [Google Scholar]
- Malespin, C., Ballance, C. P., Pindzola, M. S., et al. 2011, A&A, 526, A115 [NASA ADS] [CrossRef] [EDP Sciences] [Google Scholar]
- Møller, C. 1932, Ann. Phys., 406, 531 [CrossRef] [Google Scholar]
- Najjari, B., & Voitkiv, A. B. 2013, Phys. Rev. A, 87, 034701 [NASA ADS] [CrossRef] [Google Scholar]
- Safronova, U. I., Safronova, A. S., Hamasha, S. M., & Beiersdorfer, P. 2006, At. Data Nucl. Data Tables, 92, 47 [NASA ADS] [CrossRef] [Google Scholar]
- Sampson, D. H., Zhang, H. L., & Fontes, C. J. 2009, Phys. Rep., 477, 111 [NASA ADS] [CrossRef] [Google Scholar]
- Santos, J. P., Parente, F., & Indelicato, P. 1998, Eur. Phys. J. D, 3, 43 [NASA ADS] [CrossRef] [EDP Sciences] [Google Scholar]
- Schlegel, E. M., Shipley, H. V., Rana, V. R., Barrett, P. E., & Singh, K. P. 2014, ApJ, 797, 38 [NASA ADS] [CrossRef] [Google Scholar]
- Shen, T. M., Chen, C. Y., Wang, Y. S., & Zou, Y. M. 2009, Eur. Phys. J. D, 53, 179 [NASA ADS] [CrossRef] [EDP Sciences] [Google Scholar]
- Shen, T. M., Chen, C. Y., Wang, Y. S., Zou, Y. M., & Gu, M. F. 2007a, Phys. Rev. A, 76, 022703 [NASA ADS] [CrossRef] [Google Scholar]
- Shen, T. M., Chen, C. Y., Wang, Y. S., Zou, Y. M., & Gu, M. F. 2007b, J. Phys. B, 40, 3075 [NASA ADS] [CrossRef] [Google Scholar]
- Smith, R. K., Brickhouse, N. S., Liedahl, D. A., & Raymond, J. C. 2001, ApJ, 556, L91 [NASA ADS] [CrossRef] [Google Scholar]
- Thorn, D. B., Beiersdorfer, P., Brown, G. V., et al. 2009, J. Phys. Conf. Ser., 163, 012036 [NASA ADS] [CrossRef] [Google Scholar]
- Wang, K., Chen, C., Huang, M., Wang, Y., & Zou, Y. 2011, At. Data Nucl. Data Tables, 97, 426 [Google Scholar]
- Wang, K., Yan, J., Huang, M., et al. 2012, At. Data Nucl. Data Tables, 98, 779 [Google Scholar]
- Zhang, H. L., & Fontes, C. J. 2013, At. Data Nucl. Data Tables, 99, 416 [NASA ADS] [CrossRef] [Google Scholar]
- Zhang, H. L., & Fontes, C. J. 2015, At. Data Nucl. Data Tables, 101, 41 [NASA ADS] [CrossRef] [Google Scholar]
- Zhang, H. L., & Sampson, D. H. 1992, At. Data Nucl. Data Tables, 52, 143 [NASA ADS] [CrossRef] [Google Scholar]
- Zhang, H. L., & Sampson, D. H. 1994, At. Data Nucl. Data Tables, 56, 41 [NASA ADS] [CrossRef] [Google Scholar]
- Zhang, H. L., & Sampson, D. H. 1996, At. Data Nucl. Data Tables, 63, 275 [NASA ADS] [CrossRef] [Google Scholar]
- Zhang, H. L., & Sampson, D. H. 1999, At. Data Nucl. Data Tables, 72, 153 [NASA ADS] [CrossRef] [Google Scholar]
- Zhang, H. L., & Sampson, D. H. 2002, At. Data Nucl. Data Tables, 82, 357 [Google Scholar]
- Zhang, H. L., Sampson, D. H., & Mohanty, A. K. 1989, Phys. Rev. A, 40, 616 [NASA ADS] [CrossRef] [Google Scholar]
- Zhang, Y., Chen, C. Y., Wang, Y. S., & Zou, Y. M. 2009, J. Quant. Spectr. Radiat. Trans., 110, 2180 [Google Scholar]
All Tables
Energy (in eV) and lifetime (τ, in s) for the 36 lowest levels of H-like ions with 13 ≤ Z ≤ 42. a ± b≡ a × 10± b.
Wavelength (λ, in Å), radiative rate (Ar, in s-1), absorption oscillator strength (f, dimensionless), and line strength (S, in au) for transitions in H-like ions with 13 ≤ Z ≤ 42. TP stands for the type of transition, and a ± b≡ a × 10± b.
Collision strengths (Ω) for transitions in H-like ions with 13 ≤ Z ≤ 42. in Z2 Ry and a ± b≡ a × 10± b.
Transition energy (Eij, in eV), radiative decay rate (, in s-1), and effective collision strength (Υ) for transitions in H-like ions with 13 ≤ Z ≤ 42. in 1000 × Z2 K and a ± b≡ a × 10± b.
All Figures
|
Fig. 1 Reduced excitation cross sections of some selected a) dipole-allowed and b) forbidden transitions in Si13+. The values at the three highest energies for each transition are obtained by the relativistic Bethe form. The scattered symbols are connected with splines. |
| In the text | |
|
Fig. 2 Cross section in the high-energy region for 1s1/2 − 2p3/2 transition in Ni27+. Squares connected by splines show the present results. Values for the five highest energies are calculated by relativistic Bethe form. Dashed and dotted lines are the Møller-Kummer and Coulomb-Kummer results calculated in Bostock et al. (2013), respectively. Circles with error bars are experimental values from Thorn et al. (2009). |
| In the text | |
|
Fig. 3 Radiative damping effects on effective collision strength (ΥZ2) of 2−6(2p1/2 − 3s1/2) transition in a) Si13+ and b) Kr35+. The dashed line represents the direct excitation (DE) background contribution. The dotted line is undamped Υ results including the resonance excitation (RE) contribution. The dash-dotted line is damped results by resonant stabilizing (RS) transitions. The solid line stands for total Υ-values damped by both RS and DAC (Decays from the resonances into low-lying autoionizing levels possibly followed by autoionization cascade) transitions. |
| In the text | |
|
Fig. 4 Ratios of the total of DE and RE effective collision strengths at Te = 5 × 100Z2 K with considerations of both RS and DAC transitions to the DE values are plotted against the final state indices of the excitations. The squares, circles, triangles, diamonds, and crosses are for the excitations initially from level keys 1−4, and others, respectively. a) Si13+ and b) Kr35+. |
| In the text | |
|
Fig. 5 Comparision of the present effective collision strengths with a) undamped DARC values for Si13+ (Aggarwal & Keenan 2010) at 107.0 K and b) the damped DARC for Ni27+ (Malespin et al. 2011) at 108.2 K. |
| In the text | |
Current usage metrics show cumulative count of Article Views (full-text article views including HTML views, PDF and ePub downloads, according to the available data) and Abstracts Views on Vision4Press platform.
Data correspond to usage on the plateform after 2015. The current usage metrics is available 48-96 hours after online publication and is updated daily on week days.
Initial download of the metrics may take a while.