Fig. 5
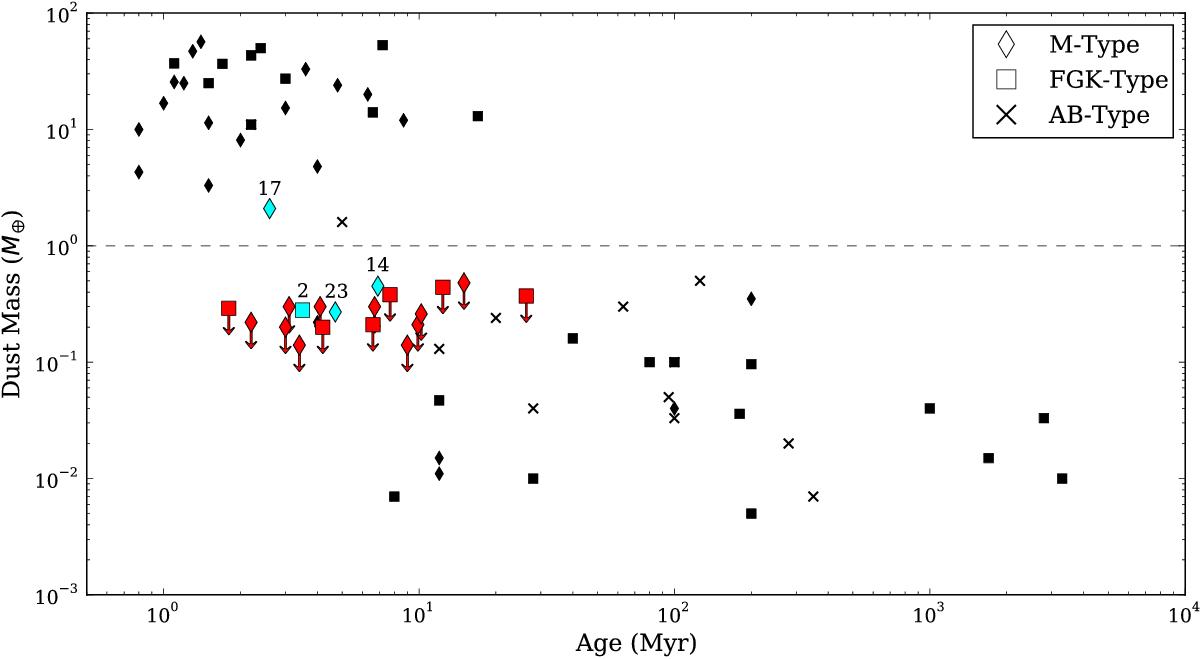
Comparison of the dust mass in our systems compared to those found in the literature. Cyan symbols denote the systems in our sample with detected 1.3 mm flux (numbered for clarity) and red symbols denote those with upper-limits. Black symbols that lie above the dotted line correspond to known protoplanetary disks (data taken from Wyatt et al. 2003; Ricci et al. 2010; Romero et al. 2012). Black symbols in the lower portion correspond to known debris disks (data taken from Greaves et al. 2004; Liu et al. 2004; Sheret et al. 2004; Najita & Williams 2005; Lestrade et al. 2006; Williams & Andrews 2006; Matthews et al. 2007). The horizontal dashed line is used to highlight the difference in dust mass between the populations.
Current usage metrics show cumulative count of Article Views (full-text article views including HTML views, PDF and ePub downloads, according to the available data) and Abstracts Views on Vision4Press platform.
Data correspond to usage on the plateform after 2015. The current usage metrics is available 48-96 hours after online publication and is updated daily on week days.
Initial download of the metrics may take a while.