Fig. 3
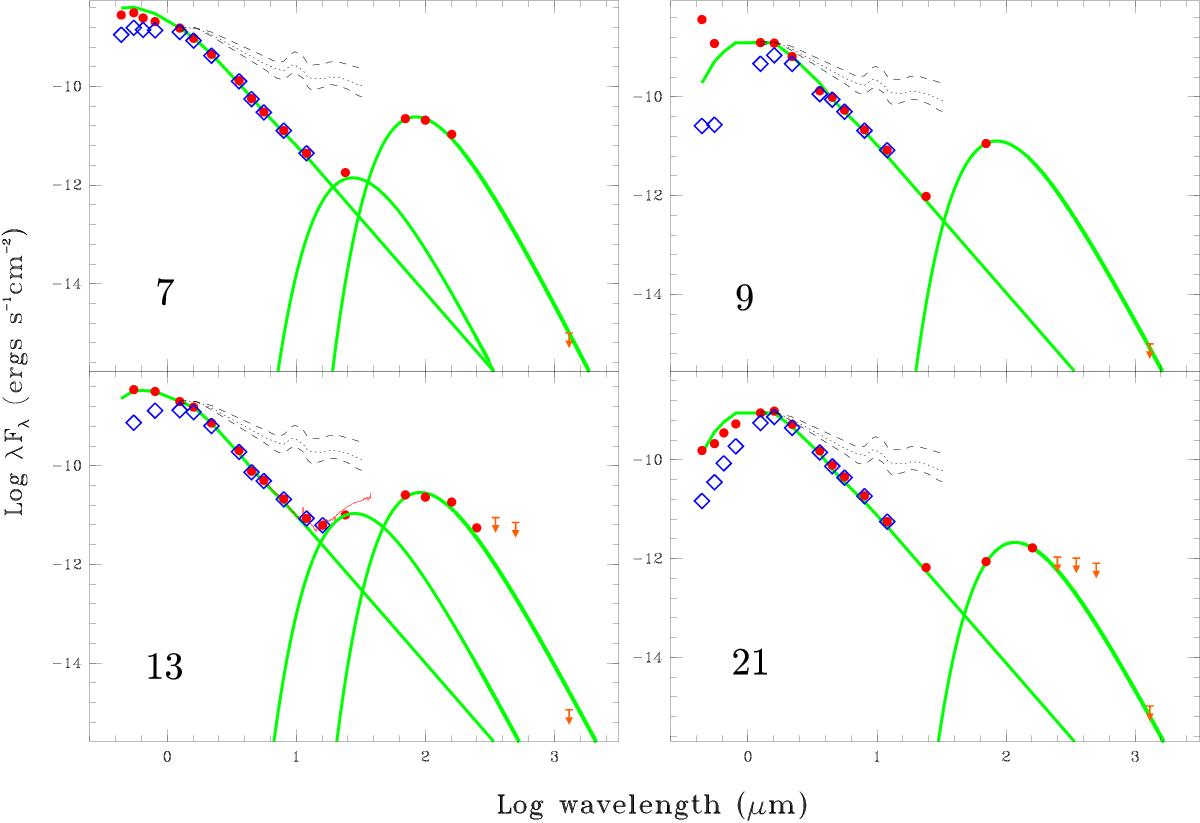
SEDs for the four systems in our sample that display considerable MIR excess, but for which there was no 1.3 mm detection. Symbols are identical to Fig. 1, with the addition of modified black body fits to determine if the emission is still consistent with one or two black bodies, taking the ALMA upper limits into consideration.
Current usage metrics show cumulative count of Article Views (full-text article views including HTML views, PDF and ePub downloads, according to the available data) and Abstracts Views on Vision4Press platform.
Data correspond to usage on the plateform after 2015. The current usage metrics is available 48-96 hours after online publication and is updated daily on week days.
Initial download of the metrics may take a while.