Fig. 2
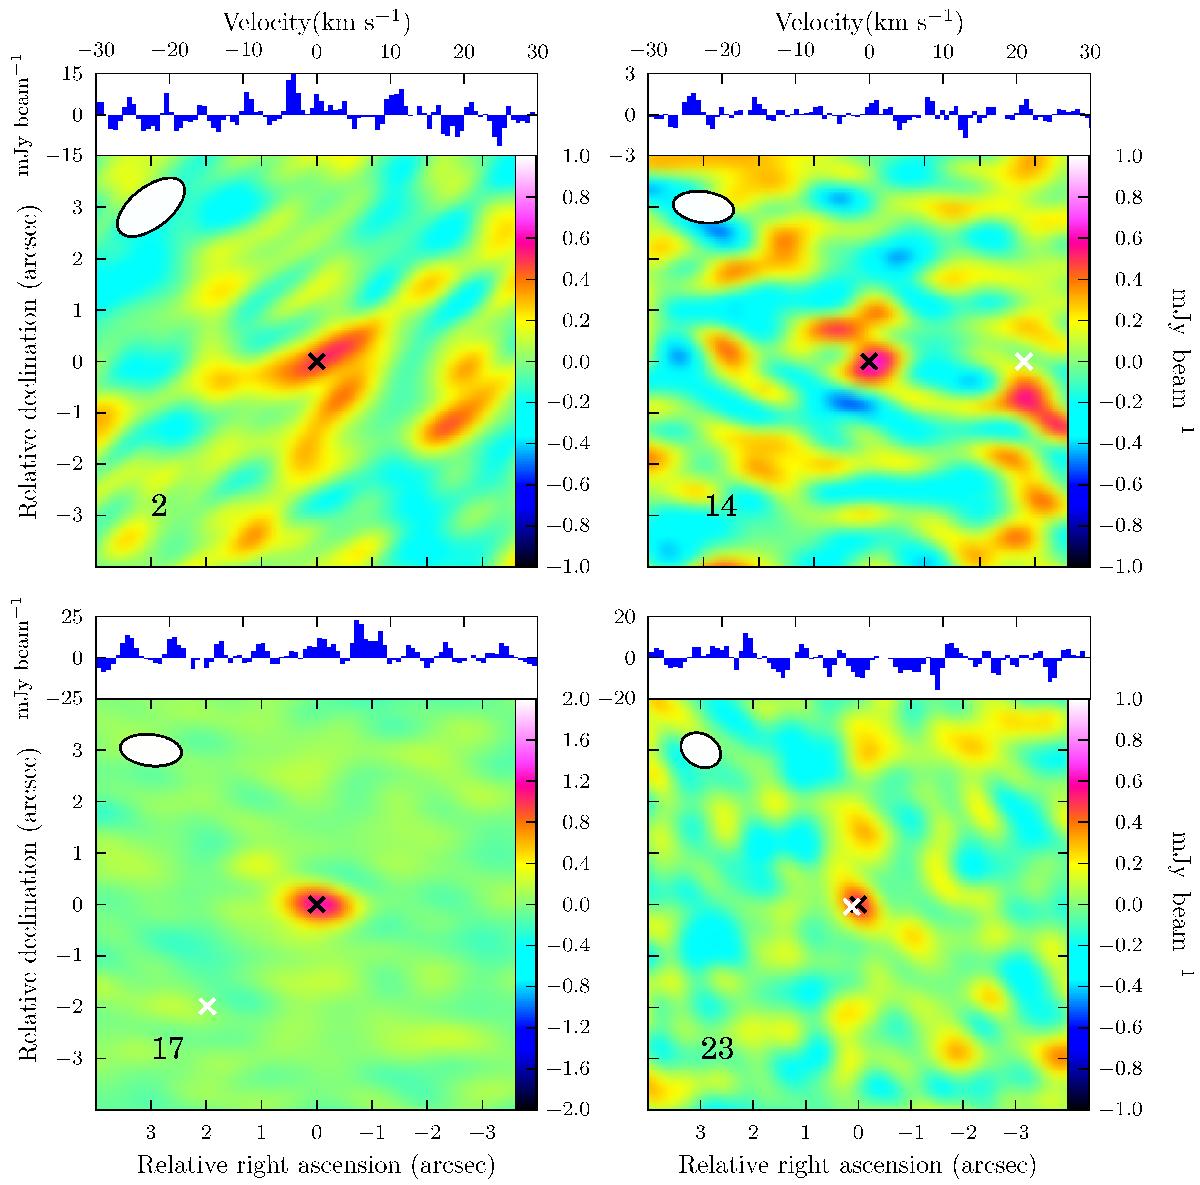
Images generated by the CLEAN algorithm for the four systems in which we detected continuum emission. The black cross denotes the position of the target, and the white cross the approximate position of any potential binary companions. The white ellipse denotes the beam size. The panel above each image displays spectra centred on the 12CO(2−1) line for the region of continuum emission, which can be seen to contain only noise.
Current usage metrics show cumulative count of Article Views (full-text article views including HTML views, PDF and ePub downloads, according to the available data) and Abstracts Views on Vision4Press platform.
Data correspond to usage on the plateform after 2015. The current usage metrics is available 48-96 hours after online publication and is updated daily on week days.
Initial download of the metrics may take a while.