Fig. 1
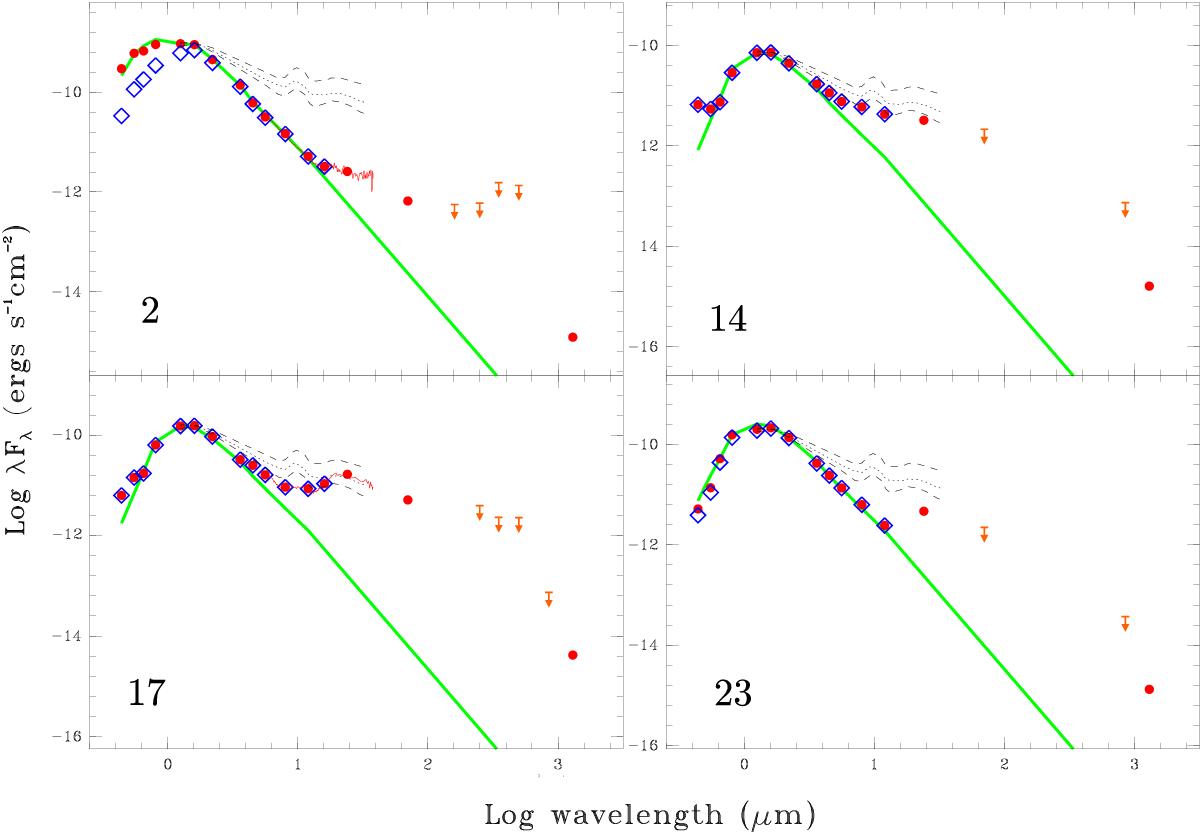
SEDs of the 4 targets in which 1.3 mm flux was detected. The filled circles are archival photometry points, with the upper limits as arrows. The blue diamonds show the flux before being corrected for extinction. The solid green lines represent the stellar photosphere normalised to the extinction-corrected J band. The dotted lines correspond to the median MIR SED of K5−M2 CTTSs calculated by Furlan et al. (2006), with the dashed lines as the upper and lower quartiles. The red line corresponds to IRS spectra, where available.
Current usage metrics show cumulative count of Article Views (full-text article views including HTML views, PDF and ePub downloads, according to the available data) and Abstracts Views on Vision4Press platform.
Data correspond to usage on the plateform after 2015. The current usage metrics is available 48-96 hours after online publication and is updated daily on week days.
Initial download of the metrics may take a while.