Fig. 1
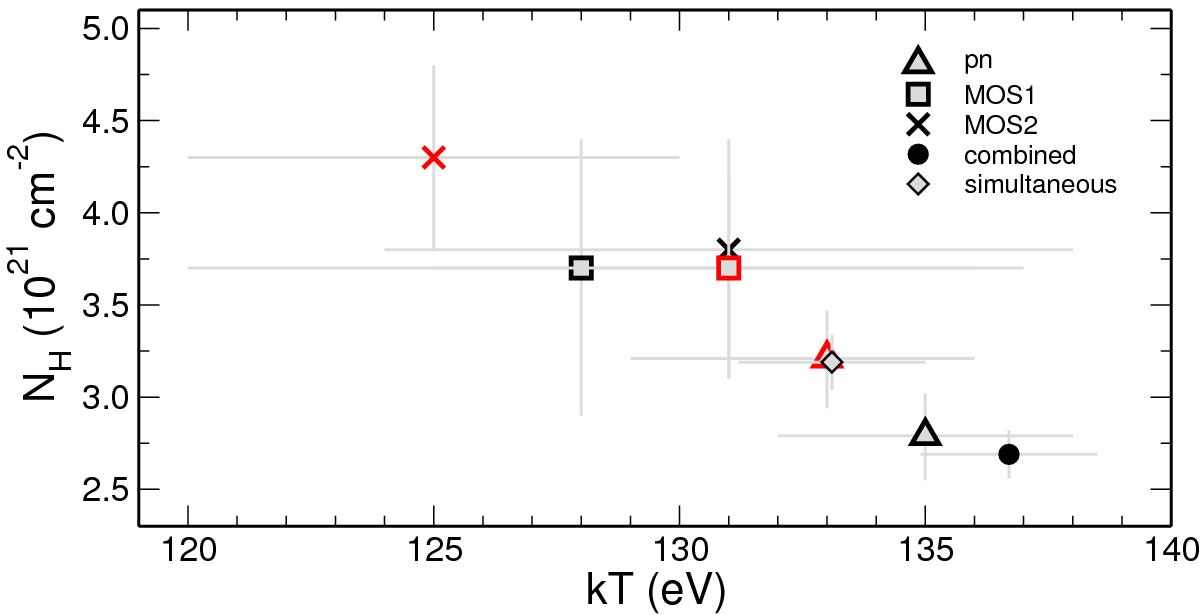
Best-fit column density NH as a function of blackbody temperature kT, for each individual (pn/MOS1/MOS2) spectrum used in the analysis (see legend). Also shown are the results by fitting all data simultaneously, as well as results of the stacked (combined) spectrum. AO11 datasets are highlighted in red. Error bars are 1σ confidence levels.
Current usage metrics show cumulative count of Article Views (full-text article views including HTML views, PDF and ePub downloads, according to the available data) and Abstracts Views on Vision4Press platform.
Data correspond to usage on the plateform after 2015. The current usage metrics is available 48-96 hours after online publication and is updated daily on week days.
Initial download of the metrics may take a while.