Fig. A.1
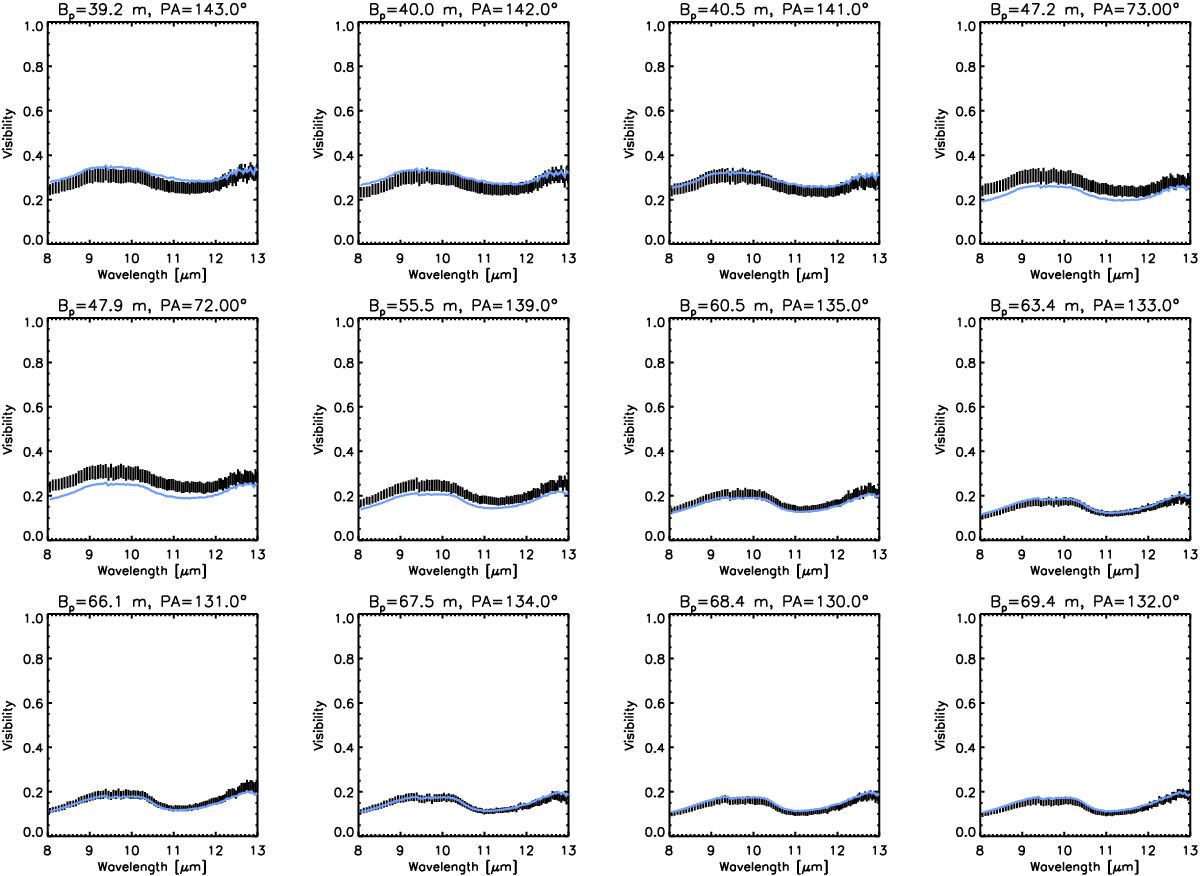
Comparison of the observational MIDI data with the best-fitting geometrical model (see Table 3). Shown are visibilities vs. wavelength at different position angles and baseline lengths (see Fig. 3 for the complete set of visibilities). Black lines represent the MIDI observations of RU Vir. Light blue lines represent the fit of the best-fitting UD+Gaussian model.
Current usage metrics show cumulative count of Article Views (full-text article views including HTML views, PDF and ePub downloads, according to the available data) and Abstracts Views on Vision4Press platform.
Data correspond to usage on the plateform after 2015. The current usage metrics is available 48-96 hours after online publication and is updated daily on week days.
Initial download of the metrics may take a while.