Free Access
Fig. 12
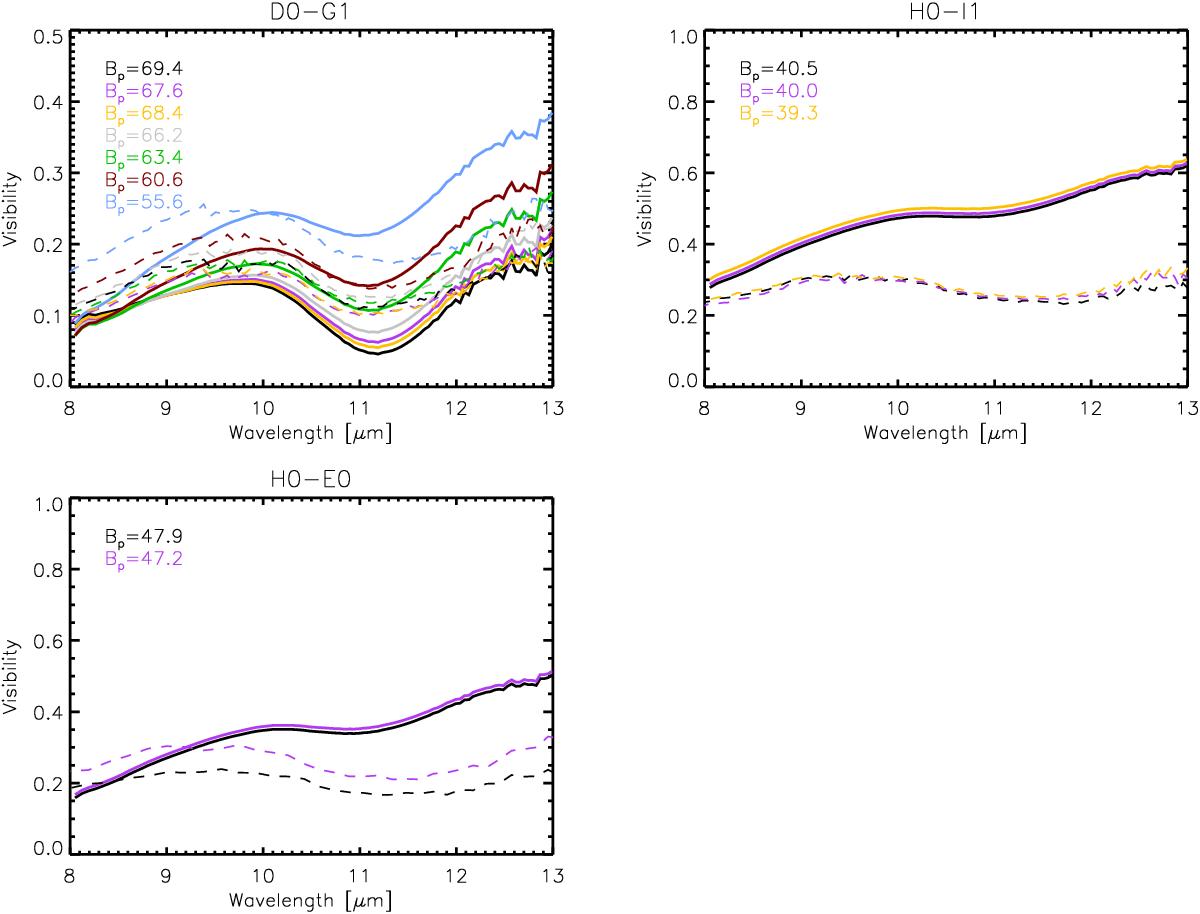
Wavelength-dependent visibilities in the MIDI range. The different panels show the three different baseline configurations of our observations. Models are plotted in full line and observations in dashed lines at different projected baselines (see colour legend).
Current usage metrics show cumulative count of Article Views (full-text article views including HTML views, PDF and ePub downloads, according to the available data) and Abstracts Views on Vision4Press platform.
Data correspond to usage on the plateform after 2015. The current usage metrics is available 48-96 hours after online publication and is updated daily on week days.
Initial download of the metrics may take a while.