Free Access
Fig. 10
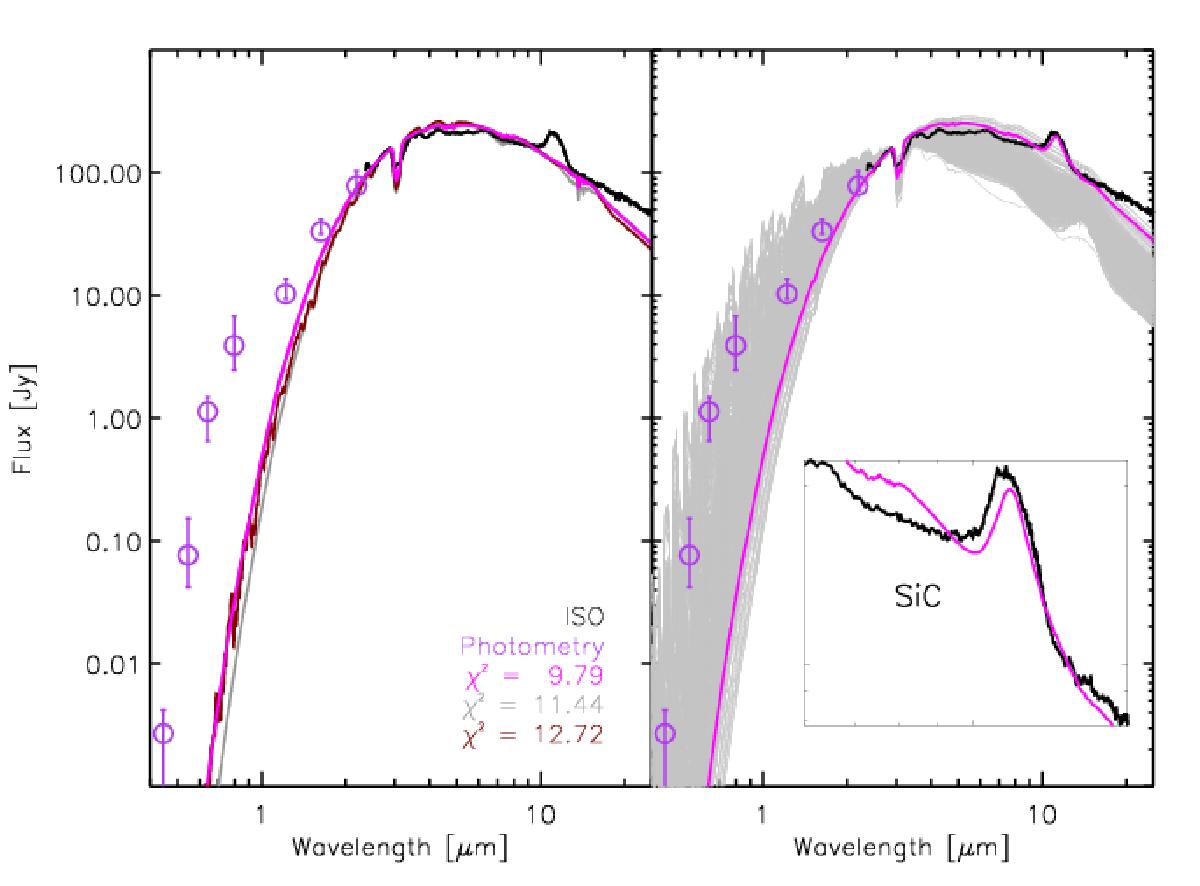
Left: observational data (ISO spectrum in black line and photometry in violet circles) compared with synthetic spectra of the three best-fitting time steps (belonging to different DMA). Right: best-fitting time step (pink) compared with ISO (black). The grey lines are the various other phases (time steps) of the same model.
Current usage metrics show cumulative count of Article Views (full-text article views including HTML views, PDF and ePub downloads, according to the available data) and Abstracts Views on Vision4Press platform.
Data correspond to usage on the plateform after 2015. The current usage metrics is available 48-96 hours after online publication and is updated daily on week days.
Initial download of the metrics may take a while.