Fig. 6
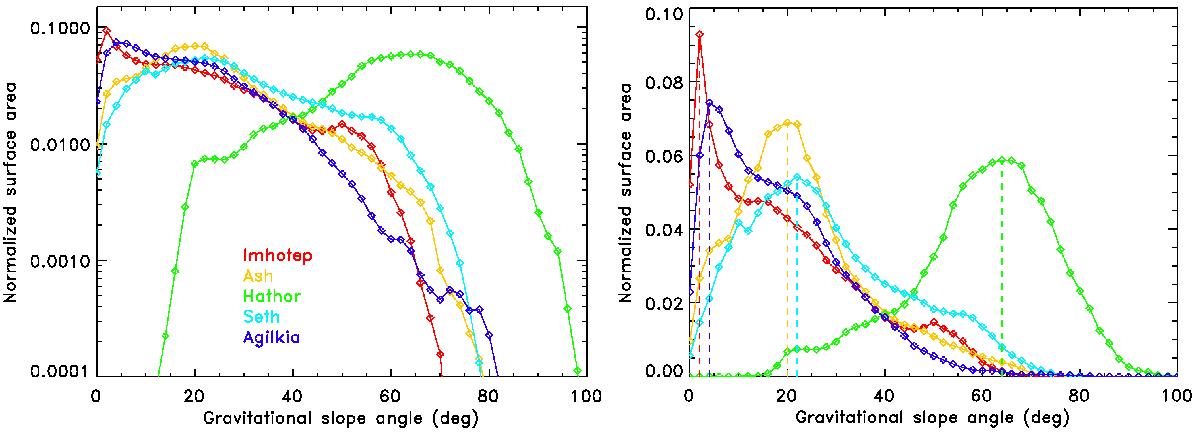
Histogram of gravitational slope angles for the five regions, with one color per region, in logarithmic scale (left) and linear scale (right) for the Y axis. The values are normalized so that the sum of all Y values equals 1. Each region has a unique distribution of gravitational slopes, related to its unique topography. All regions cover a widee range of slopes from 0° to almost 100°. The gravitational slopes were derived from the SPC shape model (Jorda et al. 2015).
Current usage metrics show cumulative count of Article Views (full-text article views including HTML views, PDF and ePub downloads, according to the available data) and Abstracts Views on Vision4Press platform.
Data correspond to usage on the plateform after 2015. The current usage metrics is available 48-96 hours after online publication and is updated daily on week days.
Initial download of the metrics may take a while.