Fig. 5
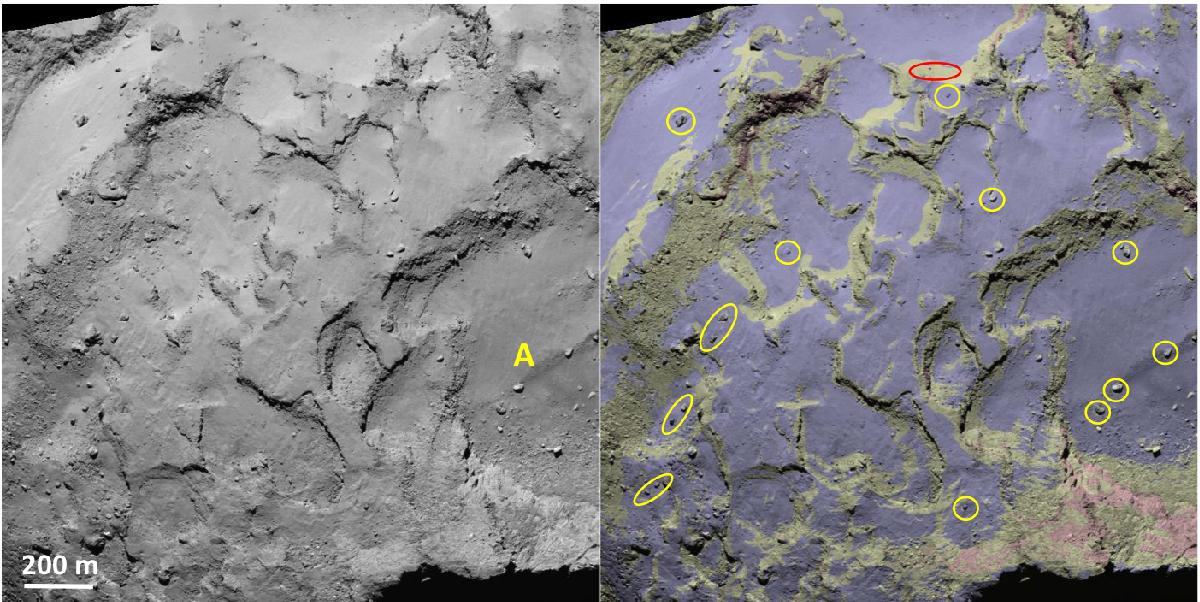
Left panel: view of the Agilkia region. The letter A indicates the largest depression of the region. Image NAC_2014-08-25T15.42.54 (spatial resolution: 0.94 m pix-1). Right panel: gravitational slopes of the Agilkia region, computed from the SPC shape model (Jorda et al. 2015), superimposed on the background image of the left panel. Blue corresponds to terrains with slope angles between 0° and 20°, yellow to terrains with slope angles between 20° and 45°, and red to terrains with slope angles between 45° and 90°. Yellow circles show examples of large and isolated boulders on slopes lower than 15°. The red circle shows an example of a smooth terrain on slopes in the range 25−30°.
Current usage metrics show cumulative count of Article Views (full-text article views including HTML views, PDF and ePub downloads, according to the available data) and Abstracts Views on Vision4Press platform.
Data correspond to usage on the plateform after 2015. The current usage metrics is available 48-96 hours after online publication and is updated daily on week days.
Initial download of the metrics may take a while.