Fig. 4
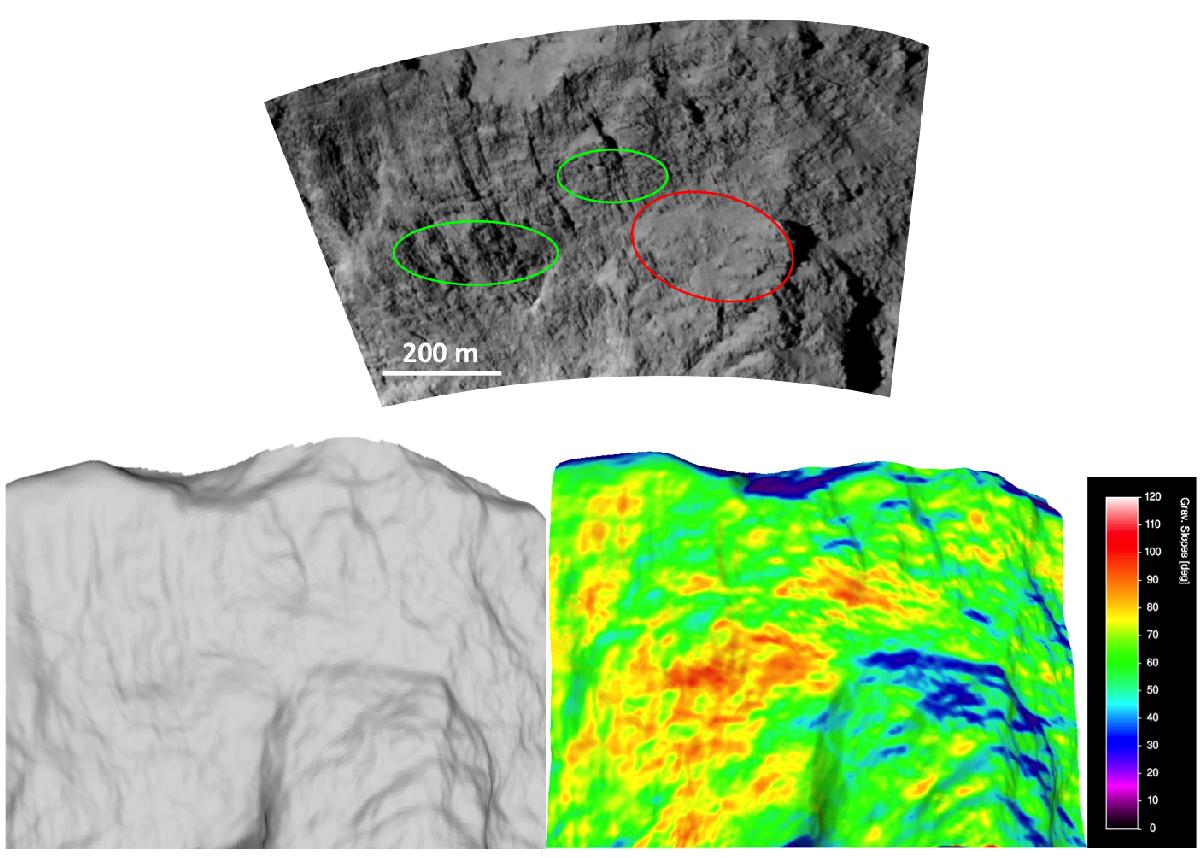
Upper panel: view of the Hathor region. Image NAC_2014-08-07T20.20.34 (spatial resolution: 1.5 m pix-1). The red circle shows an example of a smooth terrain on slopes in the range 25−30°. Green circles show examples of overhangs with slopes >90°. Lower panel: extracted Digital Terrain Model (left) of the Hathor region with the corresponding gravitational slopes (right) computed from the SPC shape model (Jorda et al. 2015). For technical reasons related to the DTM extraction, we were not able to produce a figure for Hathor like Figs. 1−3, or 5.
Current usage metrics show cumulative count of Article Views (full-text article views including HTML views, PDF and ePub downloads, according to the available data) and Abstracts Views on Vision4Press platform.
Data correspond to usage on the plateform after 2015. The current usage metrics is available 48-96 hours after online publication and is updated daily on week days.
Initial download of the metrics may take a while.