Fig. 7
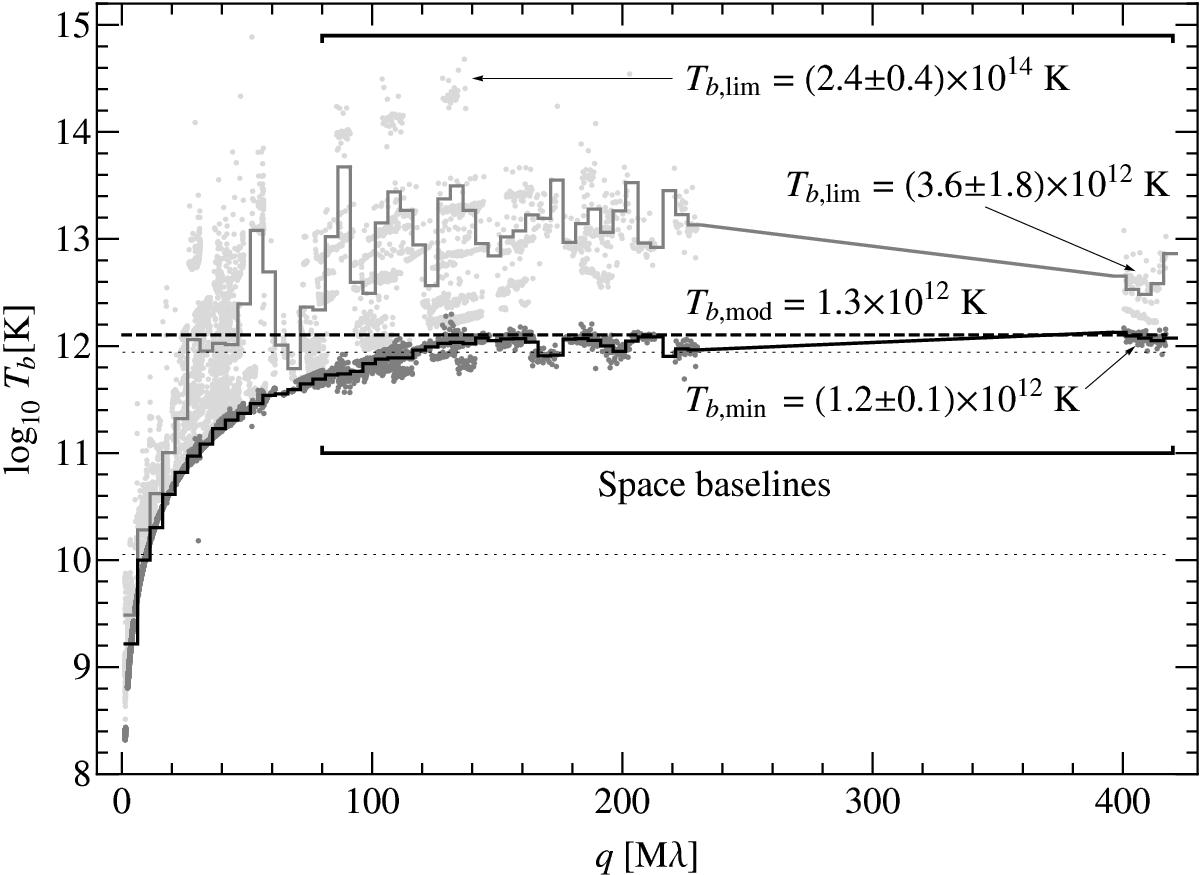
Visibility-based estimates of the brightness temperature in 0642+449, calculated in the observer’s frame. Data points represent the minimum (dark gray), Tb,min, and maximum limiting (light gray), Tb,lim, brightness temperatures derived from individual visibilities measured at different uv distances, q (Lobanov 2015). The two-dimensional distribution of Tb,lim is also presented in Fig. 1 with a color wedge. Braces above and below the brightness temperature data indicate the range of uv distances covered by the space baselines of the RadioAstron observation. The histograms show the respective brightness temperatures averaged over bins of 5 Mλ in size. The thick dashed line indicates the brightness temperature, Tb,mod = 1.3 × 10¹² K, derived for the most compact feature, C1, of the Gaussian fit of the source structure described in Table 5. The dotted lines indicate the respective brightness temperatures of the other two Gaussian components. The minimum brightness temperature, Tb,min = 1.2 × 10¹² K, is constrained by the visibilities with q> 380 Mλ. The maximum limiting brightness temperature Tb,lim = 2.4 × 10¹⁴ K can be estimated from the data on the SRT baselines to Noto and Hartebeesthoek, although potential problems with amplitude calibration cannot be ruled out. A more conservative estimate of Tb,lim = 3.6 × 10¹² K can be obtained from the data on the longest space-ground baselines.
Current usage metrics show cumulative count of Article Views (full-text article views including HTML views, PDF and ePub downloads, according to the available data) and Abstracts Views on Vision4Press platform.
Data correspond to usage on the plateform after 2015. The current usage metrics is available 48-96 hours after online publication and is updated daily on week days.
Initial download of the metrics may take a while.