Free Access
Fig. 5
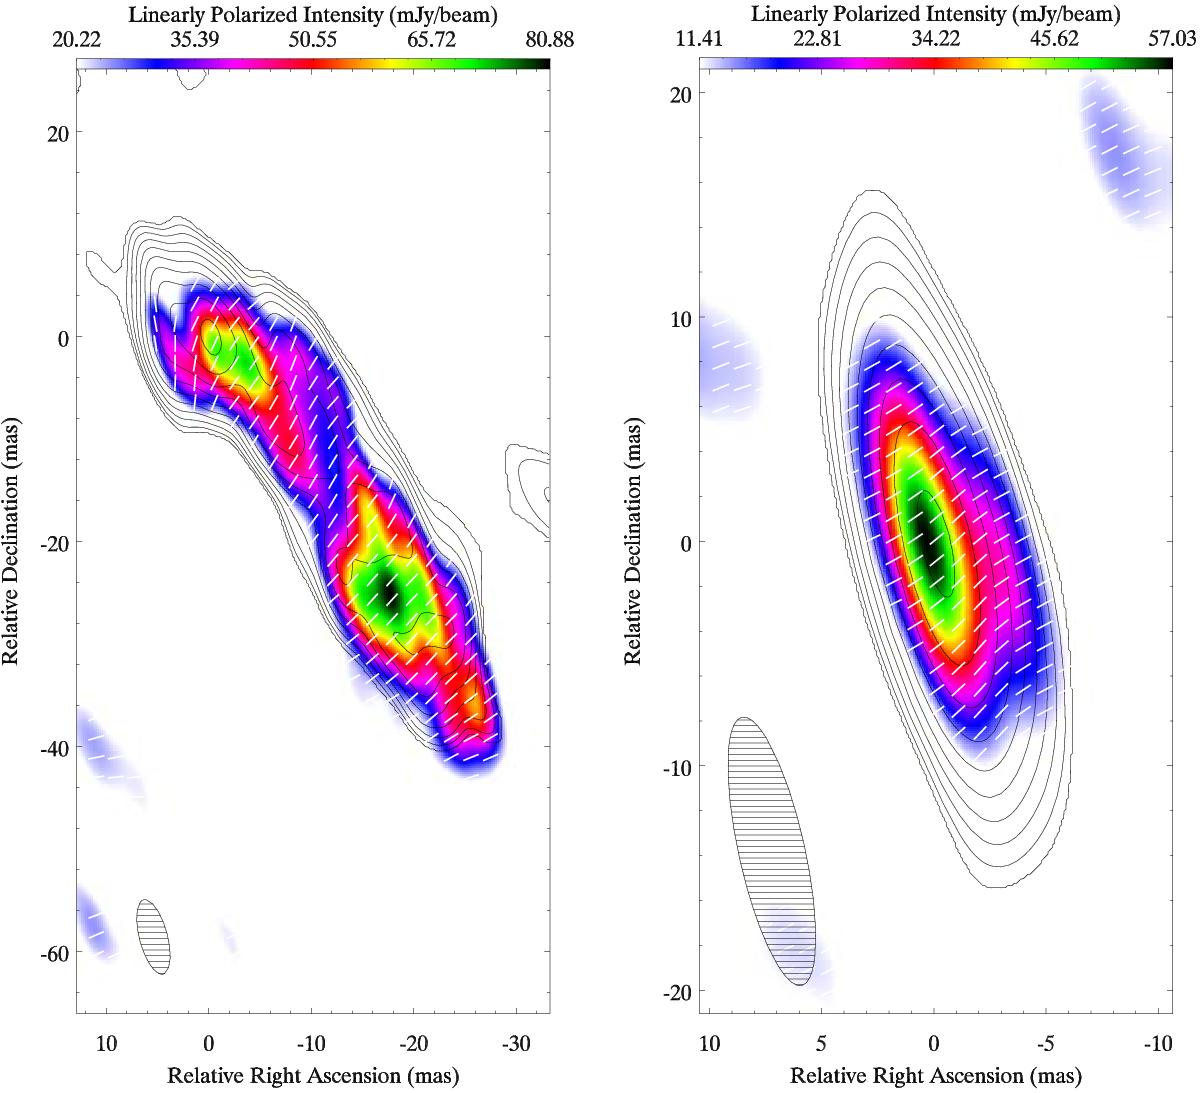
Ground array images of the calibrator sources 1328+307 (left) and 0851+202 (right), made using the uniform data weighting. Image parameters are listed in Table 6. Contours show the total intensity; colors indicate linearly polarized intensity; vectors show the EVPA orientation.
This figure is made of several images, please see below:
Current usage metrics show cumulative count of Article Views (full-text article views including HTML views, PDF and ePub downloads, according to the available data) and Abstracts Views on Vision4Press platform.
Data correspond to usage on the plateform after 2015. The current usage metrics is available 48-96 hours after online publication and is updated daily on week days.
Initial download of the metrics may take a while.