Free Access
Fig. 4
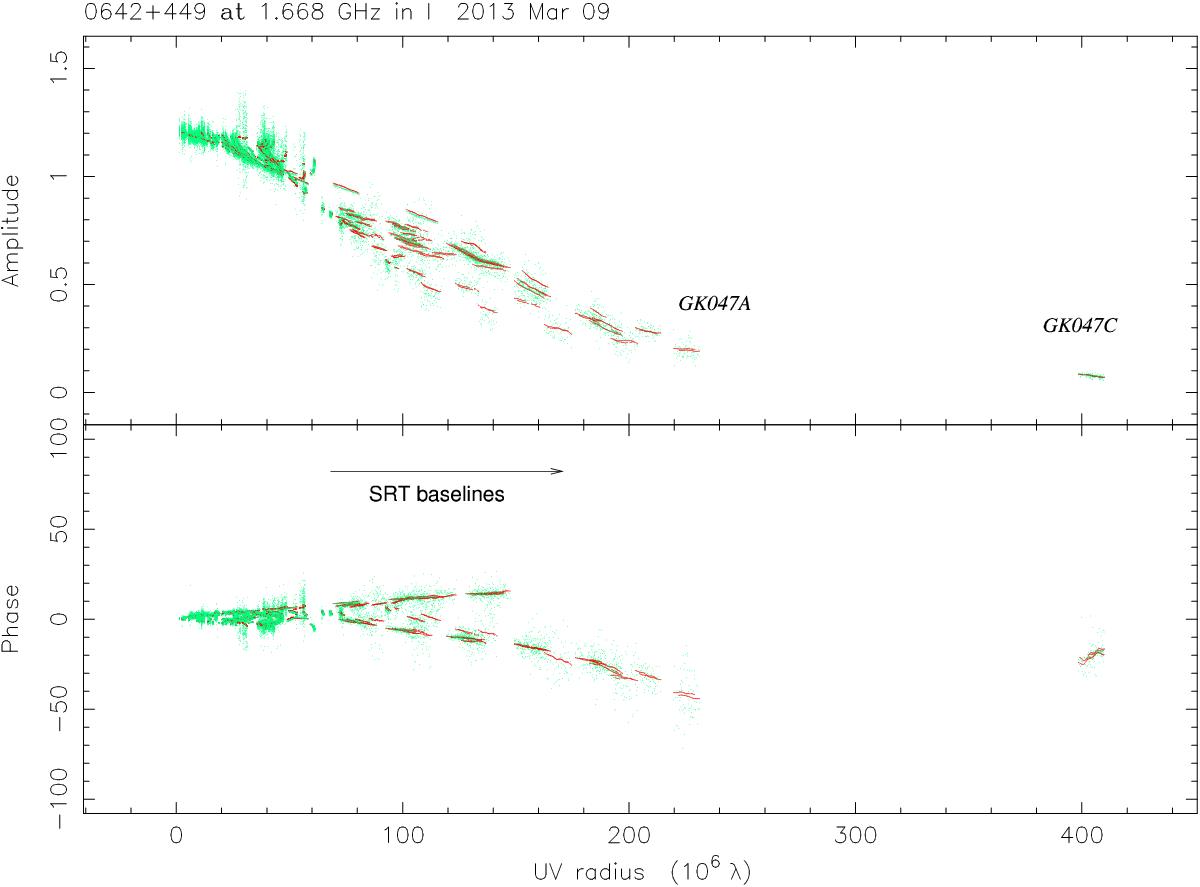
Visibility amplitude (top) and phase (bottom) distributions as a function of uv radius, overplotted with the CLEAN model (red color) obtained during the hybrid imaging of the source structure.
Current usage metrics show cumulative count of Article Views (full-text article views including HTML views, PDF and ePub downloads, according to the available data) and Abstracts Views on Vision4Press platform.
Data correspond to usage on the plateform after 2015. The current usage metrics is available 48-96 hours after online publication and is updated daily on week days.
Initial download of the metrics may take a while.