Fig. 7
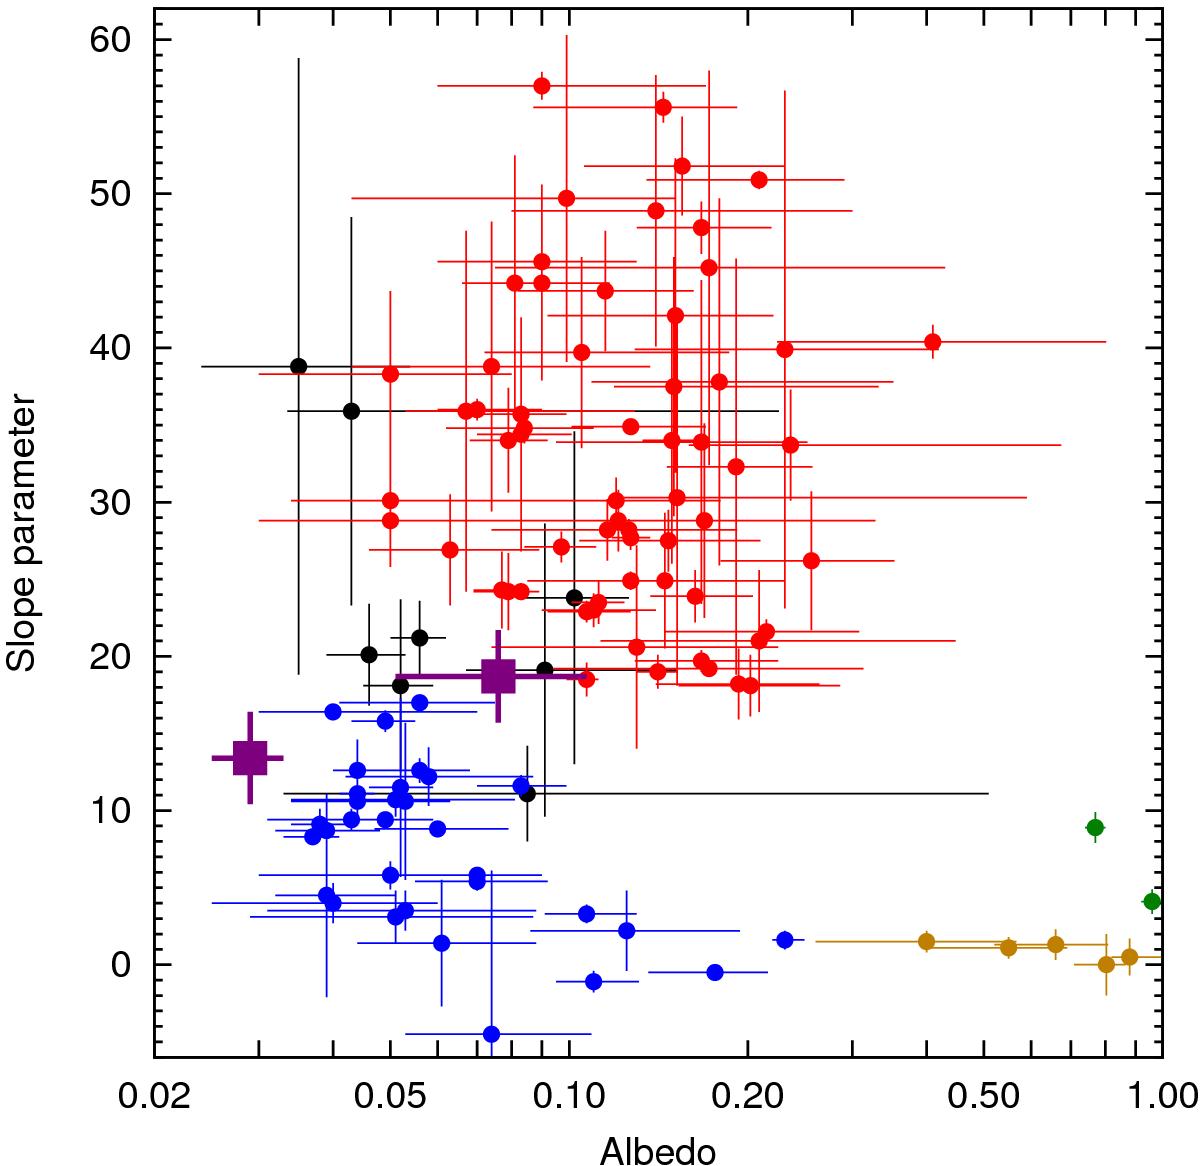
Slope parameter vs. albedo relations for 111 TNOs, including 2013 AZ60 and 2012 DR30. Data (except for these two latter objects) have been taken from Lacerda et al. (2014). The blue and red dots indicate the two major groups identified by Lacerda et al. (2014), black points represent ambiguous objects (due to their large respective uncertainties), while green and yellow dots show the large bodies and Haumea-type surfaces, respectively. The isolated purple square shows the place of 2013 AZ60 at the very left side of the diagram. The other purple square indicates 2012 DR30, just in between of the dark neutral (blue) and bright red (red) object groups.
Current usage metrics show cumulative count of Article Views (full-text article views including HTML views, PDF and ePub downloads, according to the available data) and Abstracts Views on Vision4Press platform.
Data correspond to usage on the plateform after 2015. The current usage metrics is available 48-96 hours after online publication and is updated daily on week days.
Initial download of the metrics may take a while.