Fig. 7
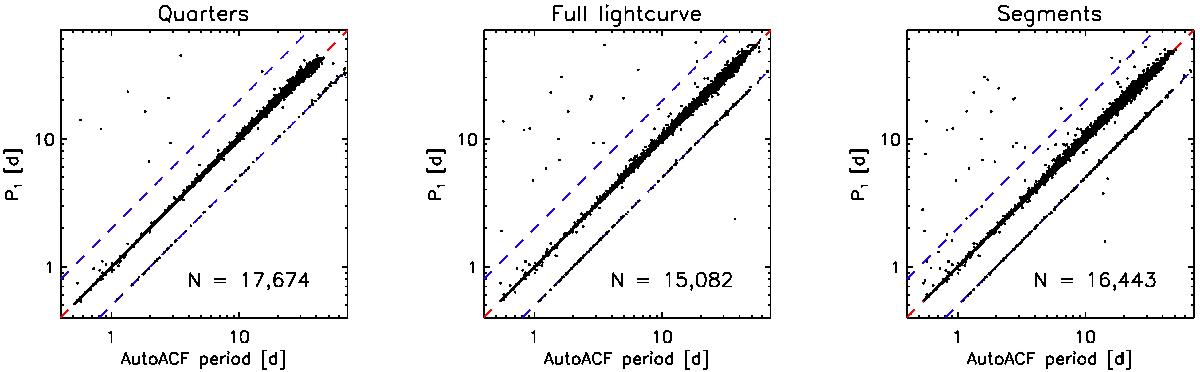
Comparison of rotation periods P1 to the results of McQuillan et al. (2014) using different methods. The dashed red line denotes the 1:1 ratio, and the upper and lower dashed blue lines indicate the 2:1 and 1:2 period ratios, respectively. For each method the number of stars matching all criteria is given in the lower right corner of each panel.
Current usage metrics show cumulative count of Article Views (full-text article views including HTML views, PDF and ePub downloads, according to the available data) and Abstracts Views on Vision4Press platform.
Data correspond to usage on the plateform after 2015. The current usage metrics is available 48-96 hours after online publication and is updated daily on week days.
Initial download of the metrics may take a while.