Fig. 5
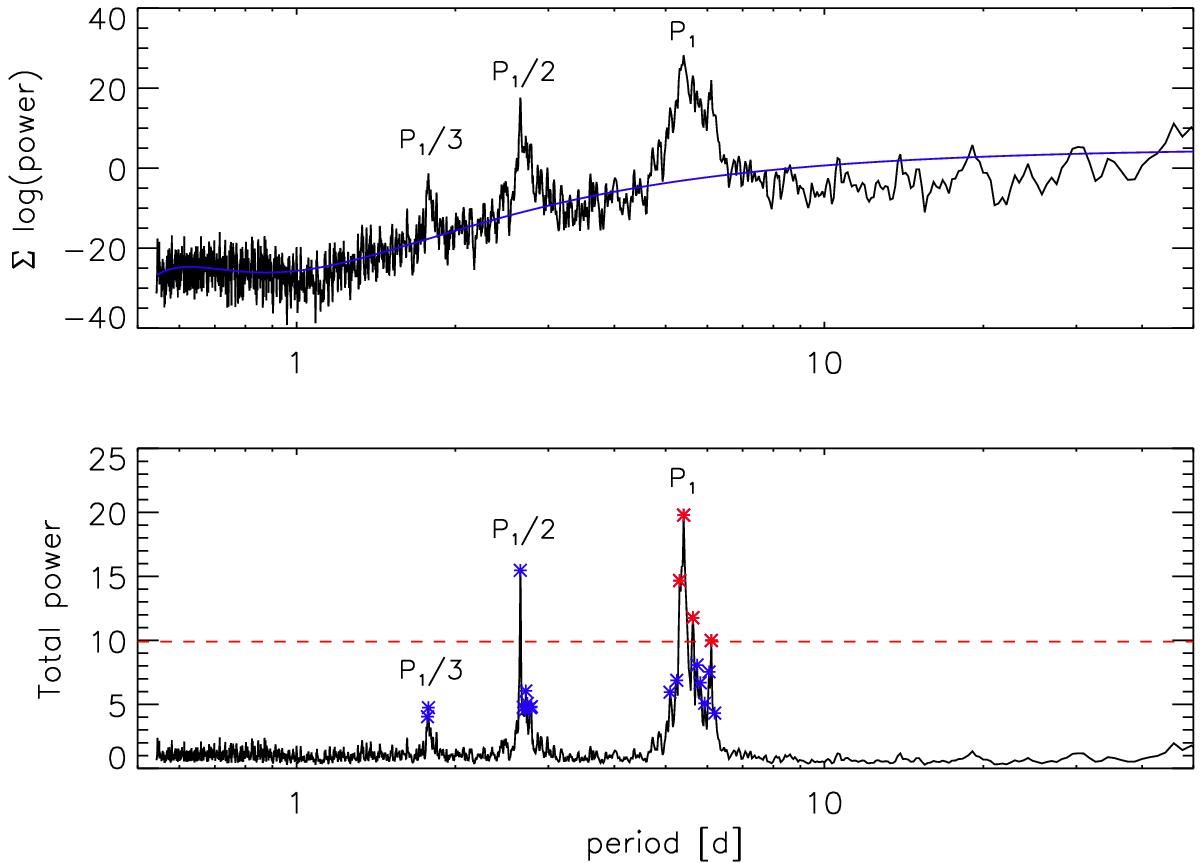
Upper panel: summed up logarithmic powers of the periodograms of the individual segments from Fig. 4. The solid blue curve shows a fourth order polynomial fit. Lower panel: exponential power of the upper panel with the polynomial fit subtracted. Peaks above the arbitrarily chosen significance limit of 0.5 h1 (dashed red line) are considered as significant, and used as a measure of DR in the following. In this picture the harmonics (P1/ 2 and P1/ 3) are also more pronounced.
Current usage metrics show cumulative count of Article Views (full-text article views including HTML views, PDF and ePub downloads, according to the available data) and Abstracts Views on Vision4Press platform.
Data correspond to usage on the plateform after 2015. The current usage metrics is available 48-96 hours after online publication and is updated daily on week days.
Initial download of the metrics may take a while.