Fig. 3
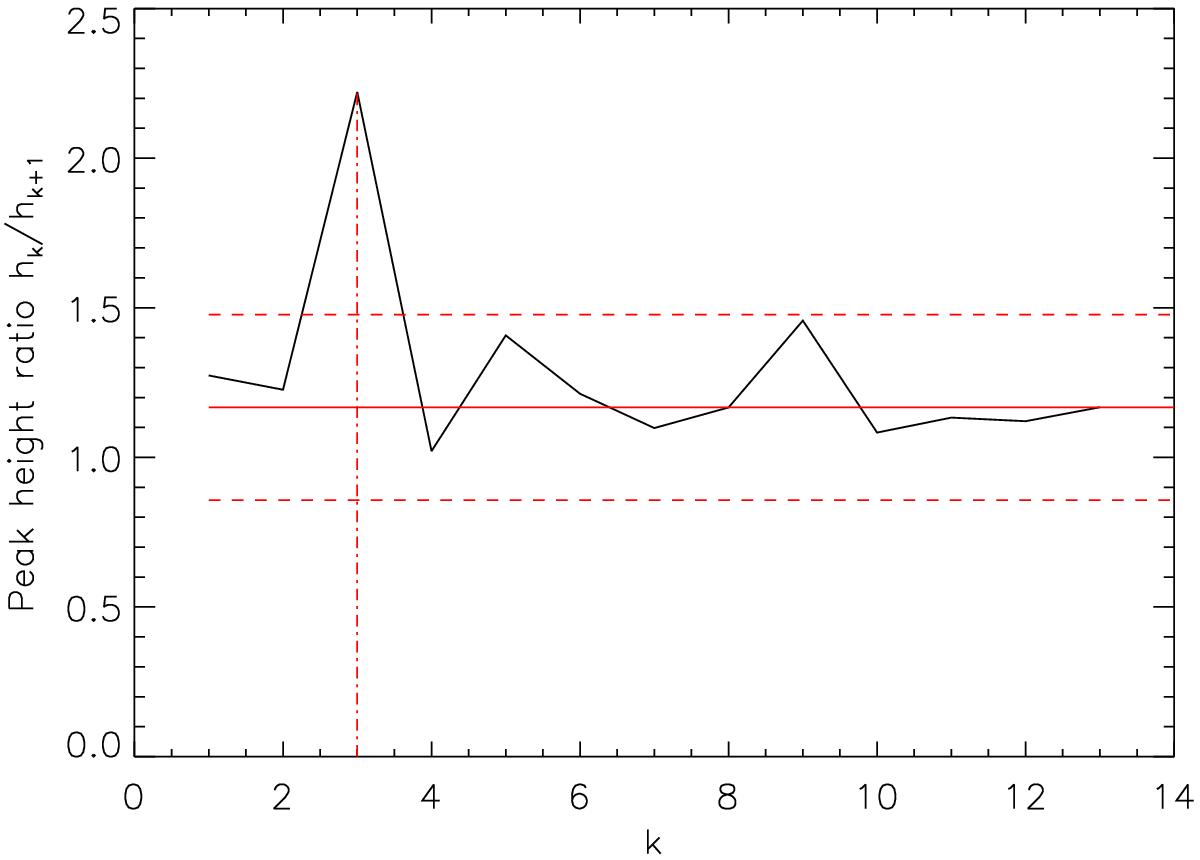
The peak height ratio (PHR) hk/hk + 1 versus peak number k of the periodogram from Fig. 2. The solid red line shows the median PHR, and the dashed red lines mark the ± 1σ levels. At k = 3 the deviation from the median is at maximum, meaning that three significant peaks were found by this method. These are marked by red asterisks in Fig. 2.
Current usage metrics show cumulative count of Article Views (full-text article views including HTML views, PDF and ePub downloads, according to the available data) and Abstracts Views on Vision4Press platform.
Data correspond to usage on the plateform after 2015. The current usage metrics is available 48-96 hours after online publication and is updated daily on week days.
Initial download of the metrics may take a while.