Fig. 2
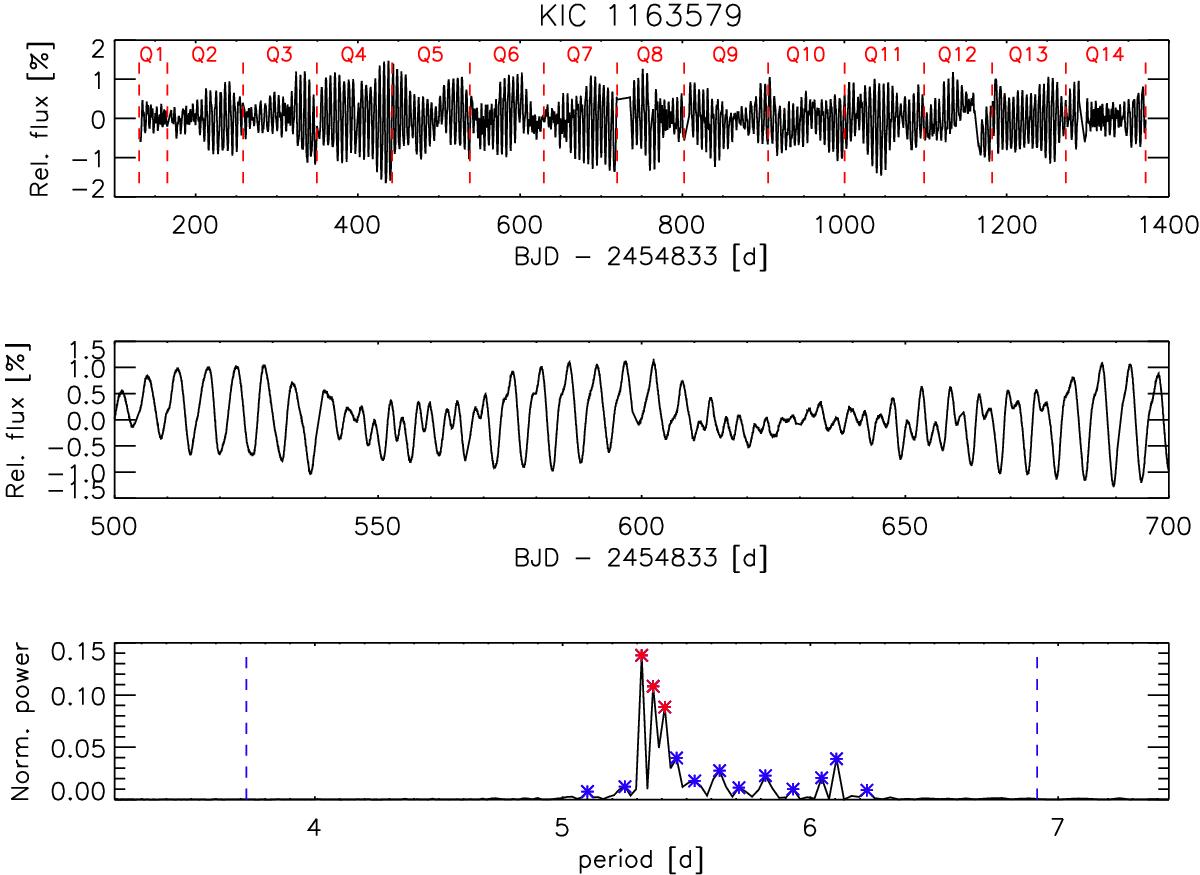
Upper panel: full light curve of the star KIC 1163579 from quarters Q1–Q14. Middle panel: zoom into the above light curve. Periodicity and the existence of a second period is clearly visible, revealed by the double-dip structure around 550 days. Lower panel: periodogram of the full light curve. Significant peaks are marked in red, other peaks in the range of P1 ± 30% (indicated by the dashed blue lines) are marked in blue.
Current usage metrics show cumulative count of Article Views (full-text article views including HTML views, PDF and ePub downloads, according to the available data) and Abstracts Views on Vision4Press platform.
Data correspond to usage on the plateform after 2015. The current usage metrics is available 48-96 hours after online publication and is updated daily on week days.
Initial download of the metrics may take a while.