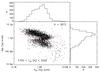
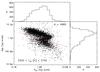
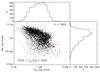
Fig. 14
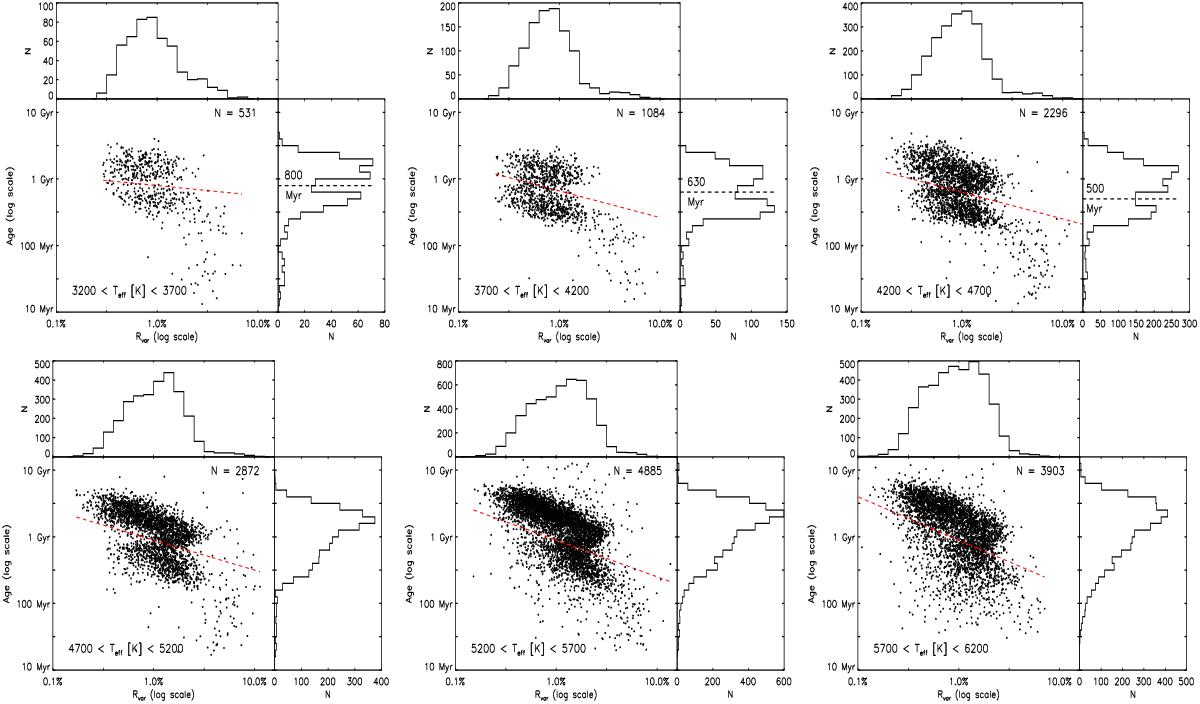
Gyrochronology ages plotted against the variability range for 500 K temperature bins between 3200–6200 K. The age distribution shows a bimodality between 3200–4700 K, which vanishes for hotter stars. The variability range Rvar decreases with age, becoming more emphasized towards hotter stars (increasing slope of dashed red line).
Current usage metrics show cumulative count of Article Views (full-text article views including HTML views, PDF and ePub downloads, according to the available data) and Abstracts Views on Vision4Press platform.
Data correspond to usage on the plateform after 2015. The current usage metrics is available 48-96 hours after online publication and is updated daily on week days.
Initial download of the metrics may take a while.