Fig. 12
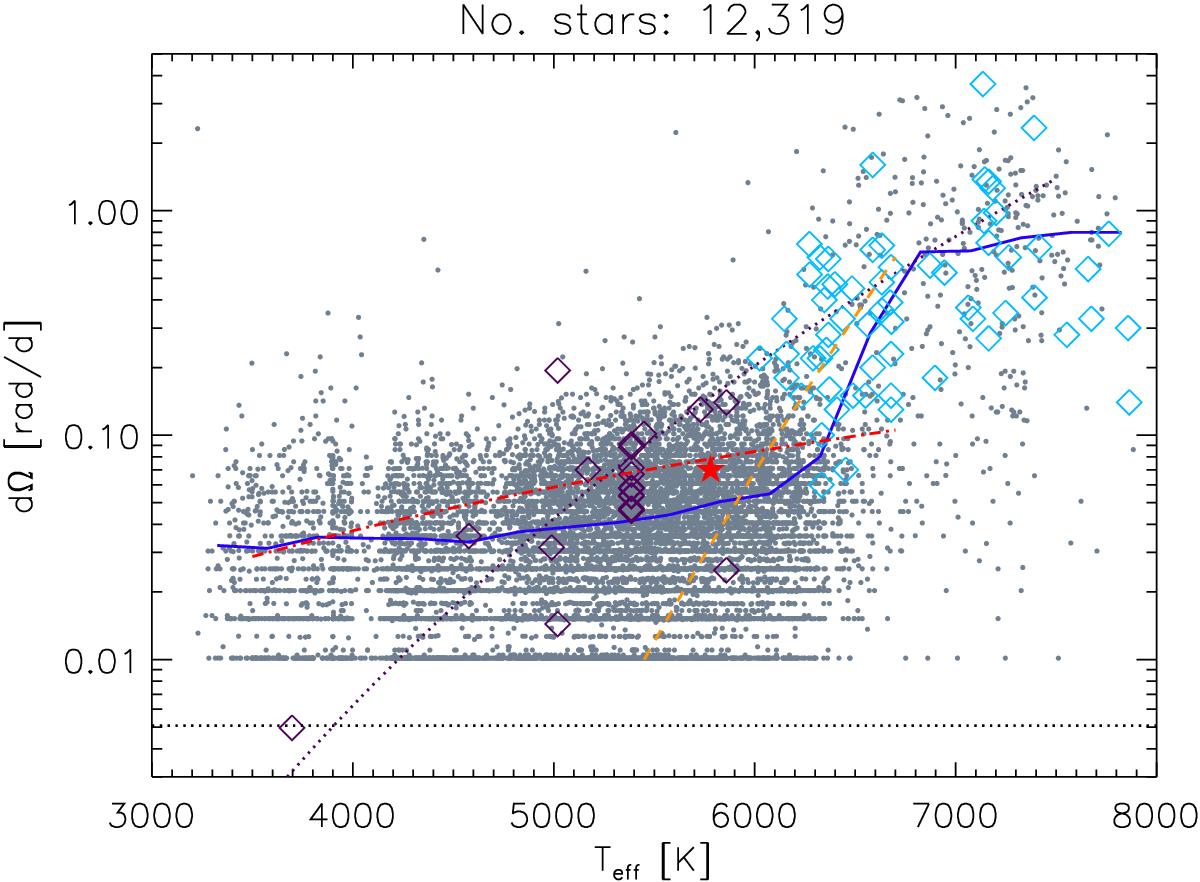
Effective temperature Teff versus absolute shear dΩ summarizing different measurements: purple diamonds were taken from Barnes et al. (2005), the dotted purple curve from Collier Cameron (2007). Light blue diamonds show measurements from Ammler-von Eiff & Reiners (2012). Our measurements are shown as gray dots. The thick blue line represents the weighted mean of our measurements for 250 K temperature bins. The dash-dotted red line and the dashed orange line show theoretical predictions from Küker & Rüdiger (2011). The dotted black line represents our detection limit, and the red star marks the position of the Sun. We find that dΩ shows weak dependence on effective temperature between 3300–6200 K. Above 6200 K dΩ strongly increases showing large scatter.
Current usage metrics show cumulative count of Article Views (full-text article views including HTML views, PDF and ePub downloads, according to the available data) and Abstracts Views on Vision4Press platform.
Data correspond to usage on the plateform after 2015. The current usage metrics is available 48-96 hours after online publication and is updated daily on week days.
Initial download of the metrics may take a while.