Fig. 7
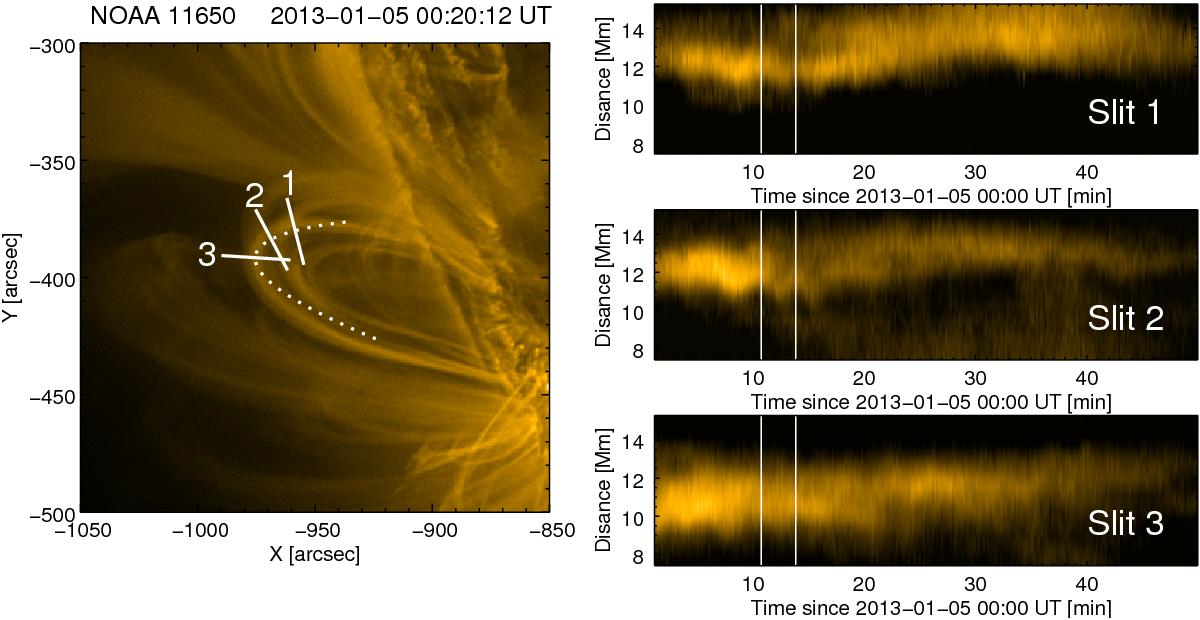
Illustration of the in phase oscillation of different loop segments. The 171 Å image of the active region NOAA 11650 taken on 5 January 2015 00:20:12 UT is presented in the left panel. The oscillated loop is highlighted with a dotted line. Bold white lines show three slits used for constructing time-distance plots. The time-distance plots for three different positions are shown in the right panel. One oscillation cycle is indicated with white vertical lines.
Current usage metrics show cumulative count of Article Views (full-text article views including HTML views, PDF and ePub downloads, according to the available data) and Abstracts Views on Vision4Press platform.
Data correspond to usage on the plateform after 2015. The current usage metrics is available 48-96 hours after online publication and is updated daily on week days.
Initial download of the metrics may take a while.