Fig. 4
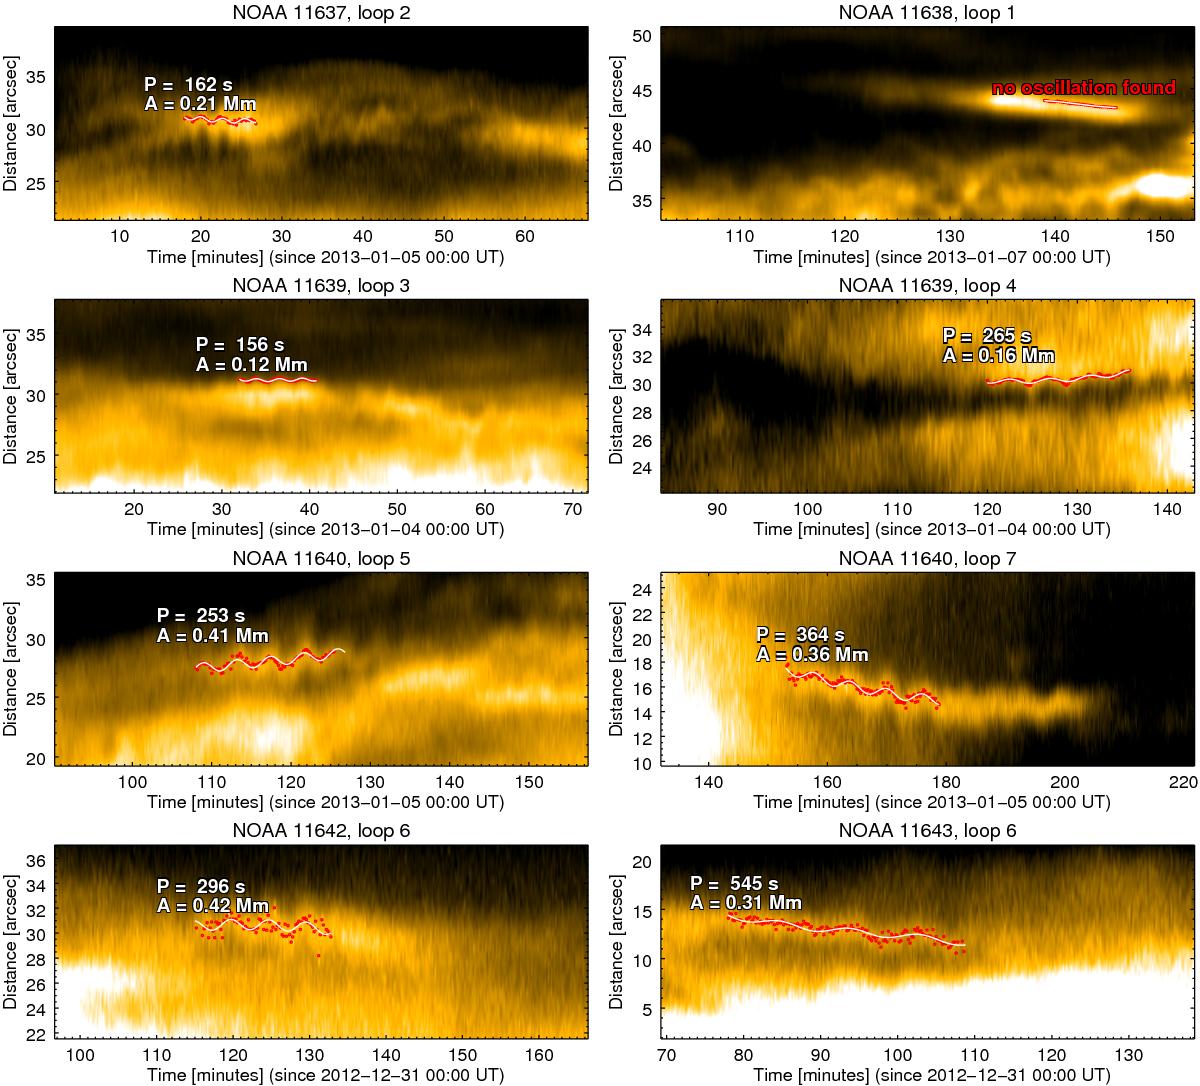
Time-distance maps of the oscillating loops found in the analysed active regions. The most noticeable oscillations are fitted with a sine function to define their period and amplitude. Red dots indicate the positions of the loop centres estimated by the Gaussian fitting. The white curves show the best-fitting sinusoidal functions. In the panels we indicate the periods and amplitudes of the detected oscillations.
Current usage metrics show cumulative count of Article Views (full-text article views including HTML views, PDF and ePub downloads, according to the available data) and Abstracts Views on Vision4Press platform.
Data correspond to usage on the plateform after 2015. The current usage metrics is available 48-96 hours after online publication and is updated daily on week days.
Initial download of the metrics may take a while.