Fig. 3
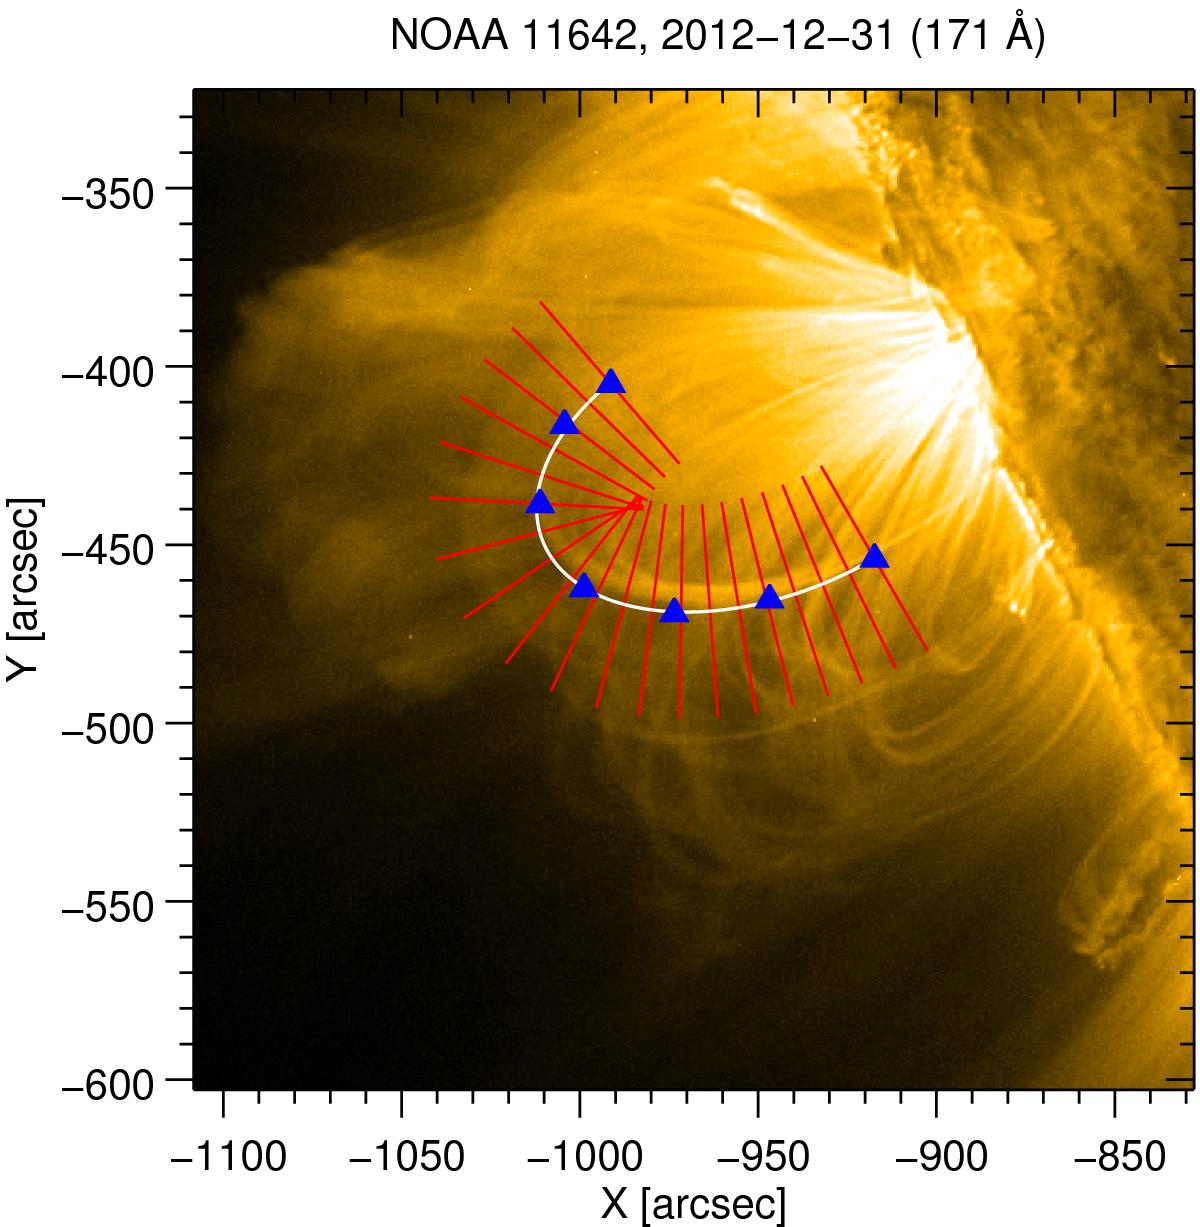
EUV image of the NOAA 11642 active region. The blue triangles show the manually selected points of the analysed loop, which is fitted with an ellipse (white curve). Transverse slits perpendicular to the apparent loop path are shown with red lines. The slits were used for making time-distance plots. For the purpose of clarity, we show only 20 slits out of 100 analysed.
Current usage metrics show cumulative count of Article Views (full-text article views including HTML views, PDF and ePub downloads, according to the available data) and Abstracts Views on Vision4Press platform.
Data correspond to usage on the plateform after 2015. The current usage metrics is available 48-96 hours after online publication and is updated daily on week days.
Initial download of the metrics may take a while.