Fig. 2
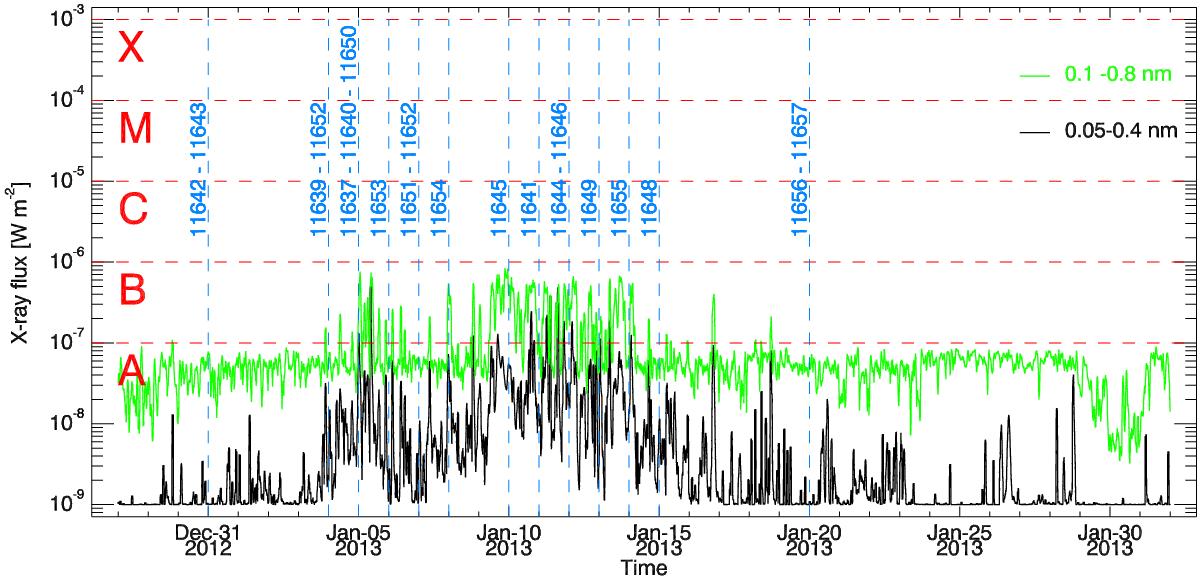
Total X-ray flux measured by the GOES 15 satellite from 28 December 2012 till 2 February 2013, in the range of 0.05–0.4 nm (black) and 0.1−0.8 nm (green) smoothed over a period of one hour. The flux is measured in units of Wm-2. The horizontal dashed red lines indicate the flare classes limits. The vertical dashed blue lines represent times of the observations listed in Table A.1, labelled with the identification numbers of the analysed active region.
Current usage metrics show cumulative count of Article Views (full-text article views including HTML views, PDF and ePub downloads, according to the available data) and Abstracts Views on Vision4Press platform.
Data correspond to usage on the plateform after 2015. The current usage metrics is available 48-96 hours after online publication and is updated daily on week days.
Initial download of the metrics may take a while.