| Issue |
A&A
Volume 583, November 2015
Rosetta mission results pre-perihelion
|
|
|---|---|---|
| Article Number | A14 | |
| Number of page(s) | 8 | |
| Section | Planets and planetary systems | |
| DOI | https://doi.org/10.1051/0004-6361/201526158 | |
| Published online | 30 October 2015 | |
Rotating dust particles in the coma of comet 67P/Churyumov-Gerasimenko
1 INAF–Osservatorio Astronomico, via Tiepolo 11, 34143 Trieste, Italy
e-mail: This email address is being protected from spambots. You need JavaScript enabled to view it.
2 INAF–Istituto di Astrofisica e Planetologia Spaziali, Area Ricerca Tor Vergata, via Fosso del Cavaliere 100, 00133 Rome, Italy
3 University of Padova, CISAS, via Venezia 15, 35100 Padova, Italy
4 Instituto de Astrofísica de Andalucía (CSIC), Glorieta de la Astronomía s/n, 18008 Granada, Spain
5 Max-Planck-Institut für Sonnensystemforschung, Justus-von-Liebig-Weg 3, 37077 Göttingen, Germany
6 LESIA, Obs. de Paris, CNRS, Univ. Paris 06, Univ. Paris-Diderot, 5 place J. Janssen, 92195 Meudon, France
7 Università degli Studi di Napoli Parthenope, Dip. di Scienze e Tecnologie, CDN IC4, 80143 Naples, Italy
8 Department of Physics and Astronomy, Padova University, Vicolo dell’Osservatorio 3, 35122 Padova, Italy
9 Laboratoire d’Astrophysique de Marseille, UMR 7326, CNRS & Aix-Marseille Université, 13388 Marseille, France
10 Centro de Astrobiologia (INTA-CSIC), 28691 Villanueva de la Canada, Madrid, Spain
11 International Space Science Institute, Hallerstrasse 6, 3012 Bern, Switzerland
12 Scientific Support Office, European Space Agency, 2201 Noordwijk, The Netherlands
13 Department of Physics and Astronomy, Uppsala University, Box 516, 75120 Uppsala, Sweden
14 PAS Space Research Center, Bartycka 18A, 00716 Warszawa, Poland
15 Institute for Geophysics and Extraterrestrial Physics, 38106 TU Braunschweig, Germany
16 Department of Astronomy, University of Maryland, College Park, MD 20742-2421, USA
17 LATMOS, CNRS/UVSQ/IPSL, 11 boulevard d’Alembert, 78280 Guyancourt, France
18 INAF–Osservatorio Astronomico di Padova, Vicolo dell’Osservatorio 5, 35122 Padova, Italy
19 CNR-IFN UOS Padova LUXOR, via Trasea 7, 35131 Padova, Italy
20 Department of Mech. Engineering – University of Padova, via Venezia 1, 35131 Padova, Italy
21 UNITN, Universitá di Trento, via Mesiano, 77, 38100 Trento, Italy
22 Institute of Planetary Research, DLR, Rutherfordstrasse 2, 12489 Berlin, Germany
23 Institute for Space Science, Nat. Central Univ., 300 Chung Da Rd., 32054 Chung-Li, Taiwan
24 ESA-ESAC, Camino Bajo del Castillo s/n., 28692 Villanueva de la Cañada, Madrid, Spain
25 Department of Physics, University of Padova, 35131 Padova, Italy
26 Institut für Datentechnik und Kommunikationsnetze, 38106 Braunschweig, Germany
27 Dept. of Information Engineering – Padova University, via Gradenigo 6, 35131 Padova, Italy
28 Instituto Nacional de Tecnica Aeroespacial, Carretera de Ajalvir, p.k. 4, 28850 Torrejon de Ardoz, Madrid, Spain
29 Physikalisches Institut, Sidlerstrasse 5, University of Bern, 3012 Bern, Switzerland
Received: 23 March 2015
Accepted: 25 June 2015
Abstract
Context. During September and October 2014, the OSIRIS cameras onboard the ESA Rosetta mission detected millions of single particles. Many of these dust particlesappear as long tracks (due to both the dust proper motion and the spacecraft motion during the exposure time) with a clear brightness periodicity.
Aims. We interpret the observed periodic features as a rotational and translational motion of aspherical dust grains.
Methods. By counting the peaks of each track, we obtained statistics of a rotation frequency. We compared these results with the rotational frequency predicted by a model of aspherical dust grain dynamics in a model gas flow. By testing many possible sets of physical conditions and grain characteristics, we constrained the rotational properties of dust grains.
Results. We analyzed on the motion of rotating aspherical dust grains with different cross sections in flow conditions corresponding to the coma of 67P/Churyumov-Gerasimenko qualitatively and quantitatively. Based on the OSIRIS observations, we constrain the possible physical parameters of the grains.
Key words: comets: general / comets: individual: 67P/Churyumov-Gerasimenko / methods: numerical / space vehicles
These authors contributed equally to this work.
© ESO, 2015
1. Introduction
A few months after its arrival at the comet 67P/Churyumov-Gerasimenko (67P), the Rosetta probe is already accumulating novel scientific data from the closest vicinity of the comet. In October 2014, at 3.0 AU heliocentric distance and in bound orbit around the comet of about 10 km, the Optical, Spectroscopic, and Infrared Remote Imaging System camera (OSIRIS; Keller et al. 2007) onboard Rosetta also gained images of the cometary dust coma, which showed traces of moving dust particles that exhibited brightness periodicity. These data can best be interpreted by means of theoretical coma models.
Cometary dust production by modeling tail and/or trail observational data images has been reviewed in Agarwal et al. (2007, 2010) and Fulle et al. (2010). Based on analyses of images of 67P, the computed velocities were in the range of 5−50 m s-1 at 1.3 AU, assuming spherical grains with a density of 103 kg m-3 in a radius-sized range of about 10 μm to 1 mm. Taking into account the grain asphericity and porosity would lead to larger grain sizes. Many ab initio physical models have been prepared to interpret observations of dust in cometary atmospheres (see Crifo et al. 2005; Combi et al. 2004, 2012; and Tenishev et al. 2011). All these models assume that the dust grains are spherical. However, the stratospheric interplanetary dust particles (IDPs; Rotundi et al. 2007, 2014) or the samples brought by the Stardust mission from comet 81P/Wild (Brownlee et al. 2006; Zolensky et al. 2006; Rotundi & Rietmeijer 2008) imply strongly irregular dust shapes by origin.
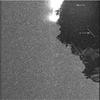 |
Fig. 1 OSIRIS NAC image taken on 22 October 2014, 01h17m12s UT. The dust coma is resolved in single particles of subpixel apparent sizes, visible as tracks due to proper and spacecraft motion during the exposure time of 5.7 s. Some tracks show a periodic brightness variation during the exposure. The light curves of tracks marked by labels a and b are shown in Fig. 2. |
The complex motion of aspherical particles cannot be described sufficiently precisely by the dynamics of spherical particles. Even the motion of particles with shapes very close to a sphere (e.g., axially symmetric ellipsoids) exhibit variations in the grain velocity that are due to active forces and the torque. Aspherical dust dynamics with test grains of ellipsoidal shape in a spherically expanding flow has been studied in Ivanovski et al. (2013). In this paper, we studied the dynamics of test grains of ellipsoidal shape as a first attempt to interpret the dust tracks of 67P with brightness periodicity. The model adopts the following assumptions: (i) spherically symmetric vacuum outflow of gas; (ii) a homogeneous, non-rotating spherical nucleus; (iii) axially symmetric grains of a constant mass, shape and temperature; and (iv) a grain motion governed by the nucleus gravity, aerodynamic forces and torque.
During the terminator orbits at 10 km from the nucleus center performed during October 2014, the OSIRIS Narrow (NAC) and Wide Angle (WAC) Cameras (Keller et al. 2007) collected many images showing a coma that was completely resolved in single particles of subpixel apparent sizes. The vectorial sum of the dust proper motion and spacecraft motion produced long rectilinear tracks in the images (Fig. 1). Many of these tracks showed regular brightness variations, probably due to the rotation of aspherical particles during the exposure. In this paper we focus on the frequency of the observed brightness variations, which is independent of all other particle parameters. A few tracks, characterized by the best signal-to-noise ratio (S/N), allowed us to extract the ratio of brightness between maxima and minima, which is almost constant along all the tracks. This suggests a simple aspherical shape, like the ellipsoids assumed in this paper.
Single large particles were previously detected by a space probe. The Deep Impact spacecraft, on its extended EPOXI mission to flyby the short-period comet 103P/Hartley 2 (hereafter 103P) around its perihelion, collected many images showing a cloud of discrete particles surrounding that nucleus (A’Hearn et al. 2011). The particles of 103P had upper limits of the radius between 0.2 and 2 m, depending on the assumed albedo (Kelley et al. 2013). The particles were displaced anti-sunward, suggesting that either they were icy and pushed into that direction by sublimation (rocket force), or that they were fluffy aggregates, moved by solar radiation. Several particles could be tracked in subsequent images (Hermalin et al. 2013), and mostly moved slowly (less than a few meters per second). Yet most of their velocities exceeded the nucleus escape velocity (0.3 m s-1). Both 103P and 67P have a radar cross section lower than 0.7 km2 (Kamoun et al. 2014).
2. OSIRIS data
We selected tracks showing a regular brightness periodicity, and at least three brightness maxima, to avoid possible contaminations by two independent short dust tracks owing to two different particles (in most images, the track density reaches 50% of some image areas). When the track was many pixels long, so that the above contamination was improbable, then two brightness maxima were also taken into account. We conclude that the brightness frequencies are well sampled above three times the inverse of the exposure time. If the shape of the grain is simple like the assumed ellipsoids, the grain rotation frequency is half of this value. The exposure time of the images is the only parameter affecting our measurements. The method of computing the statistics of these frequencies is independent of the size, distance and shape of the analyzed particle. All these parameters determine the actual brightness and length of the tracks and could not be separated in most cases. Some of the analyzed tracks are out of focus. A more detailed analysis is ongoing to determine the grain distance from the spacecraft from the optical characteristics of the cameras. Figure 2 shows two examples of the light curves associated with rotating particles (the track a is out of focus, so that the particle distance from the spacecraft can be estimated). These examples show that we were able to detect all tracks showing brightness variations larger than half of the brightness peak. This corresponds to particles with a ratio between the largest and smallest cross sections higher than a factor two (assuming particles of uniform albedo).
Figures 3 and 4 show our analysis of NAC images of the sequence LIMB9 on 21−22 October for different exposure times: 5.7 s and 18.45 s, respectively. The left panels show the number of samples as a function of the track length and number of brightness maxima (or minima). An obvious bias is clearly shown by this distribution: the longer the track, the higher the number of observed maxima. To extract the correct statistics of brightness frequency, we corrected this bias by weighting each sample by the track length. The corrected statistics of frequencies is shown in the right panels. The adopted exposure times are too short to determine the most probable rotation or oscillation frequency. In addition, for the WAC set, which is characterized by the longest exposure, we can only conclude that the most probable brightness frequency is below 0.3 Hz, meaning that the most probable rotation frequency of the grains is below 0.15 Hz. The lowest probability value to the left of the maximum is due to the bias described above for the tracks with only two brightness maxima.
3. Aspherical dust model
3.1. General considerations
We considered the dynamics of homogeneous, isothermal convex bodies (ellipsoids of revolution with different axis aspect ratios). The active forces are the nucleus gravity, the aerodynamic force and the torque. We assumed that dust grains do not affect the gas flow. In cometary atmospheres, even for the most active comets, the minimal mean free path of the molecules is on the order of meters. We study dust grains smaller than one meter and therefore we may consider the flow over the grains as free molecular. Hence, we estimated the aerodynamic force from expressions for free molecular interaction. The rotational motion of the dust grains is described by Euler kinematic and dynamic equations for rigid body. From the nucleus surface, we traced a number of grains with different initial conditions. We followed the dynamics of the grains along each trajectory to determine its terminal velocity and rotation frequency.
3.2. Model setup
To compute the dust motion we need to know the gas distribution, the gravity field and the initial conditions of the grains. The gas distribution (density, velocity, and temperature) in the coma was assumed to be given by the Euler solution for the ideal perfect gas expansion from a spherical sonic source with radius RN. This gas flow is defined by the gas specific heat ratio γ, the mass of the molecule m, the surface temperature Ts and the gas production rate Qg. The radial distributions of density, velocity and temperature are given by classical dimensionless analytical functions of the Mach number (see Gombosi 1994). We assumed a spherical gravity field of a nucleus of mass MN. The departure of the real gravity field from spherical has a negligible influence on the rotational frequency. We represent grains by ellipsoid of revolution with dimensions a along the axis of revolution and b transverse to it. We used a fixed cometocentric frame x,y,z (CCF), where x axis of the CCF extends from the center of the comet through the point of the ejection of the grain (on the nucleus surface); the y axis is perpendicular to the plane defined by the symmetry axis of the grain (a) and the x axis; the z axis completes this to the right-hand frame. The grain is initially at rest and is placed at the nucleus surface. In the assumed gas flow and gravity field, the rotation of axially symmetric particles is possible around the axis parallel to the CCF y axis. Thus the orientation of one grain can be given by the angle α between the axis −x and axis a of the grain in the (x,z) plane. Figure 5 shows the dynamical pressure profile, that is ρU2/ 2 (where ρ is the gas density and U the flow velocity). This profile reveals one important characteristic of the dust dynamics in a spherically expanding gas flow: since spherical grains move radially straight, the grain will never fall back if it leaves the surface. This is because both the dynamical pressure in a spherically expanding gas and the spherical gravity decrease as r-2 (r is cometocentric distance). Since a sphere has a constant cross section, the aerodynamic force will always remain higher than gravity.
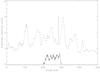 |
Fig. 2 Light curves of tracks a (dashed line) and b (solid line) in Fig. 1, both showing five maxima. The sharp peak between the third and fourth maxima is caused by to another track crossing track a. The amplitude between maxima and minima is larger than half of the brightness peak. |
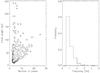 |
Fig. 3 Analysis of 20 NAC images of the sequence LIMB9 on 21−22 October, 1039 useful tracks, exposure time = 5.7 s. The frequency is the brightness frequency. The probability has been computed by weighting each track by its length. The isolevels are the number of detections in steps of powers of 2. |
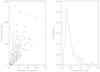 |
Fig. 4 Analysis of 20 WAC images of the sequence DUST07 and DUST08 on 12−13 and 19−20 October, 337 useful tracks, exposure time = 18.45 s. The frequency is the brightness frequency. The probability has been computed by weighting each track by its length. The isolevels are the number of detections in steps of powers of 2. |
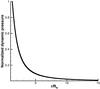 |
Fig. 5 Dynamic pressure normalized to the parameters on the surface for spherical expansion of sonic source. |
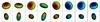 |
Fig. 6 Motion of prolate and oblate ellipsoids in a radially expanding flow (the flow direction is from the bottom left to the top right, first two snapshots in the two sequences show the oblate (a/b = 0.5) and prolate (a/b = 2) shapes. |
3.3. Equations of dust motion
The motion of the center of mass of dust grain is given by: 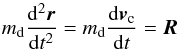 (1)where r and vc are the radius vector and the velocity of the center of mass in the fixed cometocentic frame x,y,z; md is the grain mass and R is a resulting vector of external forces. The variation of the angular momentum is given by
  (2)where Mc is a resulting momentum of external forces. Equation (2) can be represented as a set of dynamic and kinematic Euler equations (see Landau & Lifshitz 1969, Eq. (35.1)) in the moving frame, that is the frame attached to the the grain with an origin in its center of inertia. Equation (1), together with the dynamic and kinematic Euler equations, forms a close system of differential equations that describes the motion of a grain. If we assume the motion of the dust under aerodynamic and gravitational forces, for the resulting vector and the torque of external forces acting on the nonsublimating grain we obtain
 ![Mathematical equation: \begin{eqnarray} \vec R &=& \vec F_{\rm g} + \vec F_{\rm a} \notag \\ & \equiv &- G\frac{M_{\rm N} m_{\rm d}}{r^3}\vec r - \int \left( p \vec n + \tau \left[(\vec v_{\rm r} \times \vec n) \times \vec n \right]/ |v_{\rm r}| \right) {\rm d}s, \label{eqn_force} \end{eqnarray}](/articles/aa/full_html/2015/11/aa26158-15/aa26158-15-eq35.png) (3)
(3)![Mathematical equation: \begin{eqnarray} \vec M_c &=& \vec M_{\rm g} + \vec M_{\rm a} \notag \\ &\equiv& \!- G M_{\rm N} ~\rho_{\rm d} \!\! \!\int\!\! \frac{\vec l\! \times\! \vec r}{r^3}{\rm d}v -\! \!\!\int\!\! \vec l \times \left( p \vec n\! +\! \tau \left[(\vec v_{\rm r} \times \vec n) \times \vec n \right]\!/|v_{\rm r}| \right) {\rm d}s \label{eqn_torque} \end{eqnarray}](/articles/aa/full_html/2015/11/aa26158-15/aa26158-15-eq36.png) (4)where Fg and Mg are the gravitational force and torque, Fa and Ma are the aerodynamic force and torque, G is the gravitational constant, md is the mass of the dust particle, r is the nucleocentric distance, dv is the elementary volume of the body, p and τ are the gas pressure and the shear stress of the elementary surface element with area ds, l is the radius-vector of ds or dv, n is the unit vector of outward normal to the element, and vr is the gas-grain relative velocity. We note that the gravitational torque is negligible compared to the aerodynamic torque under our assumptions. To compute the gas pressure and the shear stress of the elementary surface element, we used the classical free molecular expressions (see Shen 2005)
(4)where Fg and Mg are the gravitational force and torque, Fa and Ma are the aerodynamic force and torque, G is the gravitational constant, md is the mass of the dust particle, r is the nucleocentric distance, dv is the elementary volume of the body, p and τ are the gas pressure and the shear stress of the elementary surface element with area ds, l is the radius-vector of ds or dv, n is the unit vector of outward normal to the element, and vr is the gas-grain relative velocity. We note that the gravitational torque is negligible compared to the aerodynamic torque under our assumptions. To compute the gas pressure and the shear stress of the elementary surface element, we used the classical free molecular expressions (see Shen 2005) ![Mathematical equation: \begin{eqnarray} p/p_\infty &=& \left[(2-\sigma) s \cos \beta /\! \sqrt{\pi} + \frac{\sigma}{2}\sqrt{\frac{T_{\rm d}}{T_\infty}} \right]\exp (-s^2 \cos^2 \beta) \notag \\ & & +\left[(2-\sigma)\left(\frac{1}{2}+s^2 \cos^2 \beta\right) + \frac{\sigma}{2} \sqrt{\pi} s \cos \beta\sqrt{\frac{T_{\rm d}}{T_\infty}} \right] \notag \\ & & \times\left[1+{\rm erf}(s \cos \beta)\right] \label{eqn_ppinf}~~~~~~~~~~~~~~~~~~~~~~~~~~~~~~~~~~~~~~~~~~~~~~~~~~~~~~~ \\ \tau /p_\infty &=&-\sigma s \sin \beta/\!\sqrt{\pi} \notag \\ && \times\left[\exp (-s^2 \cos^2 \beta) + \sqrt{\pi} s \cos \beta \left\{1+{\rm erf}(s \cos \beta) \right\} \right]. \label{eqn_taupinf} \end{eqnarray}](/articles/aa/full_html/2015/11/aa26158-15/aa26158-15-eq49.png) Here, ρ∞ and T∞ are the gas density and temperature at the position of the grain,
Here, ρ∞ and T∞ are the gas density and temperature at the position of the grain,  ,
,  is the gas-dust speed ratio, k is the Bolztmann constant,
  is the gas-dust relative velocity (
 is the velocity of the surface element accounting for the rotation of the grain), σ is the fraction of the molecules reflected diffusely from the grain surface, and β is the angle between vr and the inward normal direction of the element. The pressure p is codirectional to the inward normal of the element, the shear stress τ is codirectional with the projection of vr on the element plane.
4. Results
4.1. Aspherical dust simulations
The grain shape and cross section play an important role in the analysis of NAC images, because the camera tracks the surface area variation exposed to illumination. Here we consider shapes close to spheres, meaning that we consider axial symmetric ellipsoids with one radius of length a and two of length b (see Fig. 6). The motion of the axial symmetric ellipsoids in spherically expanding flow could occur in a plane, that is determined by the gas outflow vector and the axis a of the grain. The rotation is only possible around the axis perpendicular to this plane. Figure 6 illustrates the possible motion of oblate and prolate ellipsoids simulating the tracks seen in the NAC images (Fig. 1).
Parameters of the simulations are the gas production rate Qg, the grain bulk density ρd and the initial grain orientation α0.
4.2. Rotating axially symmetric grains in spherically symmetric vacuum outflow of gas
The grain has the initial velocity vd = 0, placed on the nucleus surface at RN with initial orientation defined by an angle α0, temperature Td and zero angular velocity. We integrated Eq. (1) and the dynamic and kinematic Euler equations until the grain reached its terminal velocity v∞ at some instant t∞, and we checked the obtained rotation frequency ν∞. We studied dust grains with b ranging from one millimeter to a few tens of centimeters and several aspect ratios a/b (prolate and oblate ellipsoidal shapes). The input parameters of all computations were the radius of the nucleus, RN = 2.0 × 10³ m, the mass of the nucleus, MN = 1.0 × 10¹³ kg (Sierks et al. 2015), the surface temperature, Ts = 200 K, the specific heat ratio of gas, γ = 1.33, and the mass of the molecule, m = 3.0 × 10⁻²⁶ kg. The fraction of gas molecules reflected diffusively from the grain surface is σ = 1.0. The parameters related to each case are listed in Table 1. The gas production rate (source of H2O) is Qg = 5 × 1026 s-1 in agreement with gas data results of the ROSINA instrument onboard Rosetta (Hassig et al. 2015).
The shape and cross section of a grain are among the key parameters that influence the aerodynamic behavior of aspherical grains. The summary of the relevant cases is reported in Table 1. The parameters are: the grain bulk density ρd, the nucleocentric distance L∞ at which the terminal velocity v∞ is reached, the corresponding flight time t∞ and the rotational frequency ν∞ = ω/ (2π) (where ω is the angular velocity), the distance L90 at which 90% of the terminal velocity has been reached, the corresponding flight time t90, and the time trs when the dust particle has started to make a full rotation. Δmax and Δmin are the maximum and minimum amplitudes of the oscillation of the grain, that is a coupled backward-forward movement of the grain with an increasing duration, respectively. In case of a rotating grain, the minimum amplitude of the oscillation is reported at the very last instant before the grain starts to rotate.
In the simulations we assumed that grains do not contain any volatile material, that is, neither grain mass-loss, nor shape changes during their motion. Since the aerodynamics and the torque depend upon the re-emission of the impacting molecules, we here assumed that the grains were isothermal at all times and have a constant temperature. Grain temperature changes are expected to induce modest changes in the aerodynamic force (e.g., a temperature variation of a factor two changes the aerodynamic force by less than 30%).
The main effort in this paper is to understand the NAC observations by studying the differences in the motion of dust grains with the same size but different in shape and initial orientation. The first two group cases in Table 1 show the dynamical parameters of oblate (cases #omd, a/b = 0.5) and prolate (cases #pmd, a/b = 2) grains of millimeter radius. Grains of the lowest assumed bulk density (ρd = 100 kg m-3) reach the highest velocity of all considered cases. Since we evaluated the dust motion of grains of the same size (and same cross section) in each group simulations, the low bulk density leads to the lower mass, which allows faster acceleration of these grains when compared to their analogs of higher bulk density. For dust bulk density of 700 and 1000 kg m-3, we obtained velocities in a range of 0.5−1 m s-1 for both shapes. The differences coming from the different grain shapes appear in the rotation frequencies. The grains show about one to six rotations per 100 s, but the oblate grains of the group of cases #a1 do rotate whereas their prolate analogs at the same initial orientations do not. It is worth noting that compact grains (ρd ≥ 700 kg m-3) start to rotate before these grains reach their terminal velocities, while for porous grains the opposite occurs. When the initial orientation of the grains is varied, the velocities remain similar, showing an increase for the oblate and a decrease for the prolate grains because a larger or smaller cross section is exposed to the flow. If α0 = 45°, the rotation is triggered after a time about twice as long.
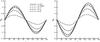 |
Fig. 7 Torque (CM) coefficients for an ellipsoid a/b = 2 (left) and a/b = 0.5 (right) for complete diffuse reflection of the molecules (σ = 1) and Td/T∞ = 2. The range of the speed ratio s is chosen to cover a range of possible flow conditions. The speed ratio represents the ratio of the relative velocity of the gas-dust flow with respect to the thermal velocity of the gas molecules. The value s = 0.815 corresponds to the gas outflow conditions at the surface. |
For cm-sized grains we discuss only cases of higher gas production rate. The gas production rate of 5 × 1026 s-1 is too low in a spherically expanding flow to trigger any rotation for such grains. Since the gas is not homogeneous in the coma of 67P, we can consider higher production rates (see cases #oc – #pc) and obtain a few rotations per 1000 s. The variation of the dimensionless torque coefficient CM = Mc/ (1/2ρU2SA) (where S is the characteristic cross section, A is the characteristic size of the grain and U is the flow velocity) in Fig. 7 shows that such grains have an equilibrium position at α = 0° (stable equilibrium for an oblate grain) and α = 90° (stable equilibrium for a prolate grain). For their equilibrium positions, the grains keep their initial orientation and do not rotate. If a grain is not oriented in its equilibrium position, it experiences a torque and thus starts to oscillate and finally to rotate, see Fig. 8. In this figure, each oscillation of the grain produces some backward-forward rotational movements of the grain along the axis of rotation which is perpendicular to the plane of motion discussed above. The transition in the rotational frequency at about 3300 s in Fig. 8 occurs when the grain starts to experience a full rotation and the angular velocity does not change its direction anymore, or in other words, when an oscillating grain passes over its unstable equilibrium position. Hence the rotational frequency only attains positive or negative values in dependence on which direction (clockwise or counterclockwise) the grain passes over its unstable equilibrium position. The oscillation of the grain can be followed by seeing the change of the torque coefficients in Fig. 7.
Our aspherical dust simulations provide rotation frequencies consistent with the observed ones (Figs. 3 and 4) for porous grains and about ten times lower for higher bulk densities. The assumptions adopted in the current aspherical model and the bias of the observed brightness frequencies due to the NAC exposure times prevent further quantitative conclusions. The grain shapes that are more likely to be detected under the discussed physical conditions are oblate rather than prolate.
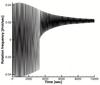 |
Fig. 8 Rotation frequency of oblate aspherical grain of case #omd2a1 (see Table 1). In the beginning, the grain experiences oscillating (decrease in the amplitude and change in the direction) which turns into a full rotation at t = 3300 s. |
5. Conclusions
The OSIRIS NAC images taken on 21−22 October 2014 show that the most probable brightness frequency is below 0.3 Hz, which means that the most probable rotation frequency of the grains is below 0.15 Hz. These low rotation frequencies suggest that rocket effects due to sublimating icy particles are negligible. In general, less than 1% of the observed particles do rotate. The systematic decay of the probability of the observed rotation frequencies (Figs. 3 and 4) excludes that tracks of uniform brightness are associated with particles rotating so fast to appear of constant brightness during the image exposures. We estimate that our sample of rotating particles is complete for all light curves with a brightness ratio between maxima and minima higher than 2 (corresponding to the same axis ratio of the ellipsoidal grains assumed in this paper). Although ellipsoids are a rough approximation of the real dust shape and the coma of 67P is far from a spherically expanding flow, our model provides frequencies consistent with those derived by the OSIRIS NAC images. Our results show that oblate ellipsoidal particles with radii of a few millimeters are a good model of the rotating particles detected by OSIRIS.
Gundlach et al. (2015) have proposed that all the dust observed in the coma of 67P is the product of fragmentation of much larger particles that break up due to the fast rotation of these parents. Our results show that this hypothesis is inconsistent with available data on the rotation spin of the observed dust. Rotundi et al. (2015) have shown that most of the particles observed in the coma of 67P are compact, with bulk densities above 800 kg m-3. This fact, coupled to the very slow spin rate, excludes significant dust fragmentation in the coma of 67P. The good agreement between the dust size distribution observed in situ by Rosetta, and that determined by ground-based observations (Rotundi et al. 2015), furthermore implies that no significant fragmentation is occurring in the coma of 67P from the nucleus distance of the Rosetta orbits (a few tens of km) up to the outermost coma boundary. Sublimation and fragmentation processes in the dust of 67P seem to be negligible, and affects less than 10% of the ejected dust mass. Most dust observed in the coma has not changed its size since its release from the nucleus surface.
Acknowledgments
OSIRIS was built by a consortium led by the Max-Planck-Institut für Sonnensystemforschung, Goettingen, Germany, in collaboration with CISAS, University of Padova, Italy, the Laboratoire d’Astrophysique de Marseille, France, the Instituto de Astrofísica de Andalucia, CSIC, Granada, Spain, the Scientific Support Office of the European Space Agency, Noordwijk, The Netherlands, the Instituto Nacional de Técnica Aeroespacial, Madrid, Spain, the Universidad Politéchnica de Madrid, Spain, the Department of Physics and Astronomy of Uppsala University, Sweden, and the Institut für Datentechnik und Kommunikationsnetze der Technischen Universität Braunschweig, Germany. The support of the national funding agencies of Germany (DLR), France (CNES), Italy (ASI), Spain (MEC), Sweden (SNSB), and the ESA Technical Directorate is gratefully acknowledged. We thank the Rosetta Science Ground Segment at ESAC, the Rosetta Mission Operations Centre at ESOC and the Rosetta Project at ESTEC for their outstanding work enabling the science return of the Rosetta Mission. This research was supported by the Italian Space Agency (ASI) within the ASI-INAF agreements I/032/05/0 and I/024/12/0.
References
- A’Hearn, M. F., Belton, M. J. S., Delamere, W., et al. 2011, Science, 332, 1396 [NASA ADS] [CrossRef] [Google Scholar]
- Agarwal, J., Müller, M., & Grün, E. 2007, Space Sci. Rev., 128, 79 [NASA ADS] [CrossRef] [Google Scholar]
- Agarwal, J., Müller, M., Reach, W. T., et al. 2010, Icarus, 207, 992 [NASA ADS] [CrossRef] [Google Scholar]
- Brownlee, D., Tsou, P., Aleon, J., et al. 2006, Science, 314, 1711 [NASA ADS] [CrossRef] [PubMed] [Google Scholar]
- Combi, M. R., Harris, W. M., & Smyth, W. H. 2004, Comets II, eds. M. C. Festou, H. U. Keller, & H. A. Weaver (Tucson: University of Arizona Press), 523 [Google Scholar]
- Combi, M., Tenishev, V. M., Rubin, M., et al. 2012, ApJ, 749, 13 [Google Scholar]
- Crifo, J.-F., Lukianov, G. A., Rodionov, A. V., Khanlarov, G. O., & Zakharov, V. V. 2002, Icarus, 156, 249 [NASA ADS] [CrossRef] [Google Scholar]
- Crifo, J.-F., Loukianov, G. A., Rodionov, A. V., & Zakharov, V. V. 2005, Icarus, 176, 192 [NASA ADS] [CrossRef] [Google Scholar]
- Fulle, M., Colangeli, L., Agarwal, J., et al. 2010, A&A, 522, A63 [NASA ADS] [CrossRef] [EDP Sciences] [Google Scholar]
- Gombosi, T. 1994, Gaskinetic Theory (Cambridge, UK: Cambridge University Press) [Google Scholar]
- Gundlach, B., Blum, J., Keller, H. U., & Skorov, Y. V. 2015, A&A, 583, A12 [NASA ADS] [CrossRef] [EDP Sciences] [Google Scholar]
- Hässig, M., Altwegg, K., Balsiger, H., et al. 2015, Science, 347, 0276 [CrossRef] [Google Scholar]
- Hermalyn, B., Farnham, T. L., Collins, S. M., et al. 2013, Icarus, 222, 625 [NASA ADS] [CrossRef] [Google Scholar]
- Ivanovski, S., Zakharov, V., Crifo, J. F., et al. 2013, EPSC Abstracts 8, European Planetary Science Congress 2013, EPSC2013-639 [Google Scholar]
- Kamoun, P., Lamy, P. L., Toth, I., & Herique, A. 2014, A&A, 568, A21 [NASA ADS] [CrossRef] [EDP Sciences] [Google Scholar]
- Keller, H. U., Barbieri, C., Lamy, P. L., et al. 2007, Space Sci. Rev., 128, 433 [NASA ADS] [CrossRef] [Google Scholar]
- Kelley, M. S., Lindler, D. J, Bodewits, D., et al. 2013, Icarus, 222, 634 [NASA ADS] [CrossRef] [Google Scholar]
- Landau, L. D., & Lifshitz, E. M. 1969, Mechanics, Vol. 1 of A Course of Theoretical Physics (Pergamon Press) [Google Scholar]
- Rotundi, A., & Rietmeijer, F. J. M. 2008, Earth Moon Planet, 102, 473 [NASA ADS] [CrossRef] [Google Scholar]
- Rotundi, A., Ferrini, G., Baratta, G. A., et al. 2007, Proc. Dust in Planetary Systems, Kauai, Hawaii, ESA SP, 643, 149 [NASA ADS] [Google Scholar]
- Rotundi, A., Rietmeijer, F. J. M., Ferrari, M., et al. 2014, Meteorit. Planet. Sci., 49, 550 [NASA ADS] [CrossRef] [Google Scholar]
- Rotundi, A., Sierks, H., Della Corte, V., et al. 2015, Science, 347, 3905 [Google Scholar]
- Shen, C. 2005, Rarefied Gas Dynamics: Fundamentals, Simulations and Micro Flows (Berlin, Heidelberg: Springer-Verlag) [Google Scholar]
- Sierks, H., Barbieri, C., Lamy, P. L., et al. 2015, Science, 347, 1044 [NASA ADS] [CrossRef] [Google Scholar]
- Tenishev, V. M., Combi, M. R., & Rubin, M. 2011, ApJ, 732, 17 [NASA ADS] [CrossRef] [Google Scholar]
- Zolensky, M. E., Zega, T. J., Yano, H., et al. 2006, Science, 314, 1735 [NASA ADS] [CrossRef] [PubMed] [Google Scholar]
All Tables
Parameters of the simulations are the gas production rate Qg, the grain bulk density ρd and the initial grain orientation α0.
All Figures
|
Fig. 1 OSIRIS NAC image taken on 22 October 2014, 01h17m12s UT. The dust coma is resolved in single particles of subpixel apparent sizes, visible as tracks due to proper and spacecraft motion during the exposure time of 5.7 s. Some tracks show a periodic brightness variation during the exposure. The light curves of tracks marked by labels a and b are shown in Fig. 2. |
| In the text | |
|
Fig. 2 Light curves of tracks a (dashed line) and b (solid line) in Fig. 1, both showing five maxima. The sharp peak between the third and fourth maxima is caused by to another track crossing track a. The amplitude between maxima and minima is larger than half of the brightness peak. |
| In the text | |
|
Fig. 3 Analysis of 20 NAC images of the sequence LIMB9 on 21−22 October, 1039 useful tracks, exposure time = 5.7 s. The frequency is the brightness frequency. The probability has been computed by weighting each track by its length. The isolevels are the number of detections in steps of powers of 2. |
| In the text | |
|
Fig. 4 Analysis of 20 WAC images of the sequence DUST07 and DUST08 on 12−13 and 19−20 October, 337 useful tracks, exposure time = 18.45 s. The frequency is the brightness frequency. The probability has been computed by weighting each track by its length. The isolevels are the number of detections in steps of powers of 2. |
| In the text | |
|
Fig. 5 Dynamic pressure normalized to the parameters on the surface for spherical expansion of sonic source. |
| In the text | |
|
Fig. 6 Motion of prolate and oblate ellipsoids in a radially expanding flow (the flow direction is from the bottom left to the top right, first two snapshots in the two sequences show the oblate (a/b = 0.5) and prolate (a/b = 2) shapes. |
| In the text | |
|
Fig. 7 Torque (CM) coefficients for an ellipsoid a/b = 2 (left) and a/b = 0.5 (right) for complete diffuse reflection of the molecules (σ = 1) and Td/T∞ = 2. The range of the speed ratio s is chosen to cover a range of possible flow conditions. The speed ratio represents the ratio of the relative velocity of the gas-dust flow with respect to the thermal velocity of the gas molecules. The value s = 0.815 corresponds to the gas outflow conditions at the surface. |
| In the text | |
|
Fig. 8 Rotation frequency of oblate aspherical grain of case #omd2a1 (see Table 1). In the beginning, the grain experiences oscillating (decrease in the amplitude and change in the direction) which turns into a full rotation at t = 3300 s. |
| In the text | |
Current usage metrics show cumulative count of Article Views (full-text article views including HTML views, PDF and ePub downloads, according to the available data) and Abstracts Views on Vision4Press platform.
Data correspond to usage on the plateform after 2015. The current usage metrics is available 48-96 hours after online publication and is updated daily on week days.
Initial download of the metrics may take a while.